Updated November 3, 2026. This article covers the definition and calculation of RSI and the conditions for interpreting the 70/30 zones and divergences. Charts and numbers are illustrative examples built from synthetic data, not measured trading results.
RSI turns the balance of recent gains and losses into a 0–100 scale
RSI (Relative Strength Index) is a momentum indicator that J. Welles Wilder Jr. introduced in his 1978 book New Concepts in Technical Trading Systems. It compares the average gain and the average loss over a period and expresses the result as a value from 0 to 100. Despite the similar name, it is a different indicator from “relative strength comparison,” which compares one security with an index.
The intuition is simple. If recent gains outweigh recent losses, RSI moves above 50; if losses dominate, below 50. With no losses at all it is 100, and with no gains at all it is 0. What matters is that it averages the size of up and down moves, not the number of up days.

The first average is simple; later values use Wilder’s smoothing
StockCharts ChartSchool documents the following sequence. The default period is the 14 that Wilder suggested. Losses are converted to positive values.
First average gain = sum of gains over the first 14 changes / 14
First average loss = sum of losses over the first 14 changes / 14
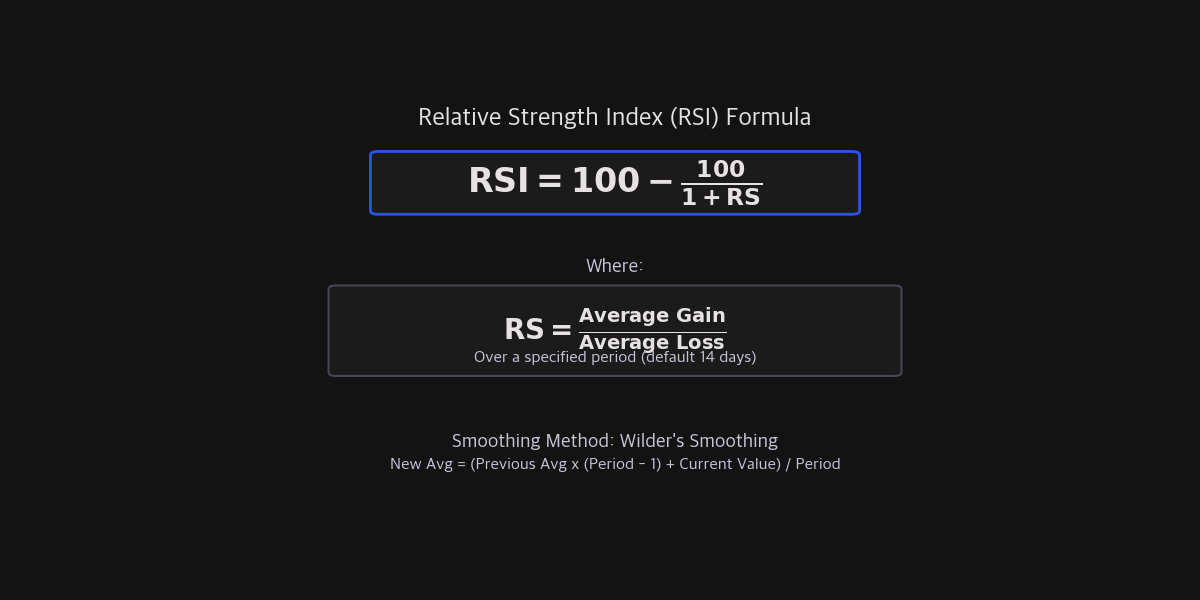
Later averages     = (prior average × 13 + current gain or loss) / 14
RS  = average gain / average loss
RSI = 100 − 100 / (1 + RS)
This smoothing is an exponential average with α = 1/14, so old values keep influencing the result for a long time. Depending on where the calculation starts and how much history is used, the RSI for the same day can differ slightly across platforms. In a backtest, recompute it from the history that would actually have been available at the time of each trade.
The code below checks values you can verify by hand on a small example with period 3. With changes of +1, −0.5, and +1, the first average gain is 2/3 and the average loss is 1/6, so RS is 4 and RSI is 80.
def wilder_rsi(closes, n=14):
    """Wilder RSI. Returns a list aligned with closes (None until n changes exist)."""
    changes = [b - a for a, b in zip(closes, closes[1:])]
    out = [None] * len(closes)
    if len(changes) < n:
        return out
    avg_gain = sum(max(c, 0) for c in changes[:n]) / n
    avg_loss = sum(max(-c, 0) for c in changes[:n]) / n

    def to_rsi(gain, loss):
        if loss == 0:
            return 100.0 if gain > 0 else 50.0
        return 100 - 100 / (1 + gain / loss)

    out[n] = to_rsi(avg_gain, avg_loss)
    for i in range(n, len(changes)):
        c = changes[i]
        avg_gain = (avg_gain * (n - 1) + max(c, 0)) / n
        avg_loss = (avg_loss * (n - 1) + max(-c, 0)) / n
        out[i + 1] = to_rsi(avg_gain, avg_loss)
    return out

closes = [10, 11, 10.5, 11.5, 12, 11]   # changes: +1, -0.5, +1, +0.5, -1
r = wilder_rsi(closes, n=3)
assert abs(r[3] - 80.0) < 1e-9          # gain 2/3, loss 1/6 -> RS 4
assert abs(r[4] - 100 * 11 / 13) < 1e-9 # gain 11/18, loss 1/9 -> RS 5.5
assert abs(r[5] - 50.0) < 1e-9          # both averages 11/27 -> RS 1

assert wilder_rsi(list(range(1, 31)))[-1] == 100.0     # no losses at all
assert wilder_rsi(list(range(30, 0, -1)))[-1] == 0.0   # no gains at all
RS is undefined when there are neither gains nor losses. The code treats that case as 50, but platforms may handle it differently, so check before comparing values.
70 and 30 are zones to watch, not trading orders
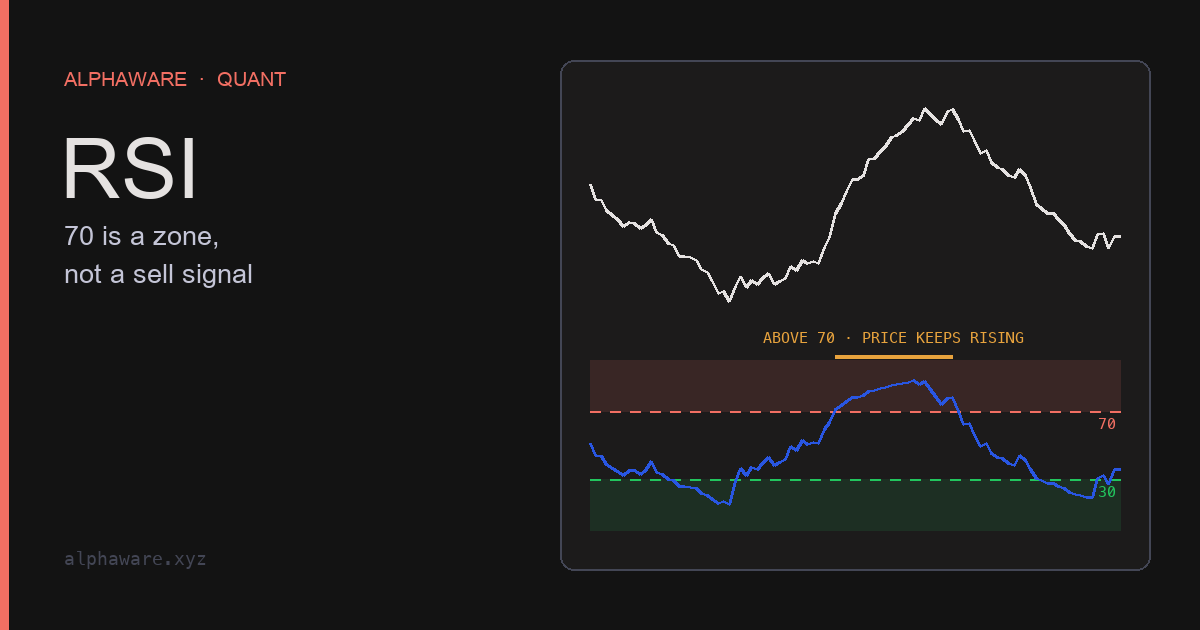
Wilder treated readings above 70 as overbought and below 30 as oversold. That describes recent movement as one-sided; it does not mean price is about to reverse. In a strong uptrend RSI can stay at or above 70 for a long time, and in a strong downtrend it can stay below 30.
| RSI zone | Wilder’s term | Reading in this article |
|---|---|---|
| 70 or above | Overbought | Recent gains clearly outweigh recent losses |
| 30–70 | Neutral | No strong tilt in either direction |
| 30 or below | Oversold | Recent losses clearly outweigh recent gains |
ChartSchool notes that these levels can be adjusted, for example to 80/20. Constance Brown also observed that RSI tends to move within roughly 40–90 in bull markets and 10–60 in bear markets. The same 70 can therefore mean different things in different market phases. These ranges are observed tendencies, not fixed laws, and should be rechecked by asset and period.
Writing a rule such as “RSI falls below 30 and then rises back above 30” makes the interpretation explicit, but whether that rule earns more than its costs is a separate question to test.
Divergences and failure swings are conditional warnings
The RSI signals Wilder described include divergences and failure swings.
Divergence
When price makes a lower low but RSI makes a higher low, it is called a bullish divergence; when price makes a higher high but RSI makes a lower high, a bearish divergence. Both are observations that recent momentum is weaker than before.
ChartSchool warns, however, that divergences are misleading in a strong trend. Bearish divergences can appear several times during a strong uptrend while price keeps rising. Andrew Cardwell considered bearish divergences a bull-market phenomenon. A divergence is more accurately read as “momentum has slowed” than as “a reversal is imminent.”
Failure swing
A failure swing looks at RSI alone, without comparing it with price. A bullish failure swing occurs when RSI drops below 30, rises back above 30, pulls back while holding above 30, and then breaks its prior RSI high. A bearish failure swing is the mirror image around 70. The definition is precise enough to turn into a rule, but the sources for this article give no evidence that it achieves a high hit rate on its own.
Test period and timeframe together
A shorter period makes RSI reach 70 and 30 more often; a longer one, less often. A 70 on a 7-period RSI does not mean the same degree of stretch as a 70 on a 21-period RSI. When the period changes, levels such as 70/30 need to be set again as well.
Timeframes raise the same issue. Hourly and daily RSI summarize movement over different spans. Reading the regime on a higher timeframe and timing entries on a lower one is common practice, but whether that combination works has to be checked separately under the same asset and cost conditions. If you tested several combinations of period, levels, and timeframe, re-validate the selection process itself with the walk-forward methods in Preventing backtest overfitting.
Fix the rules before combining RSI with other indicators
Many guides say that combining RSI with other indicators sharpens decisions, but stacking conditions does not automatically raise reliability. Two momentum indicators computed from the same price are likely to repeat similar information. John Bollinger, who created Bollinger Bands, also recommends combining indicators that are not directly related to one another. RSI and MACD both come from price momentum, so a signal from both at once cannot be counted as two independent pieces of evidence.
To use a combination, follow this order:
- Fix entry and exit conditions as numbers first. Example: “RSI(14) rises from below 30 to above 30 and the close is above the 20-day moving average.”
- Record how much each added condition reduces the number of signals. With too few signals, results depend heavily on chance.
- Include transaction costs and execution delay, then check again on a period that was not used to choose the conditions.
Sources and scope
- StockCharts ChartSchool: Relative Strength Index (RSI): Wilder (1978) origin, 14-period default, first average and smoothing formula, 70/30 levels, divergences and failure swings, Brown’s range shifts and Cardwell’s interpretation.
- Bollinger Band Rules: Bollinger’s principle of combining indicators that are not directly related.
- Park & Irwin (2007), “What Do We Know About the Profitability of Technical Analysis?”: literature review covering data snooping and ex post rule selection in technical trading studies.
- This article explains how RSI is calculated and the conditions for interpreting it. It does not claim that any RSI rule earns returns or that divergences predict reversals, and it is not investment advice.