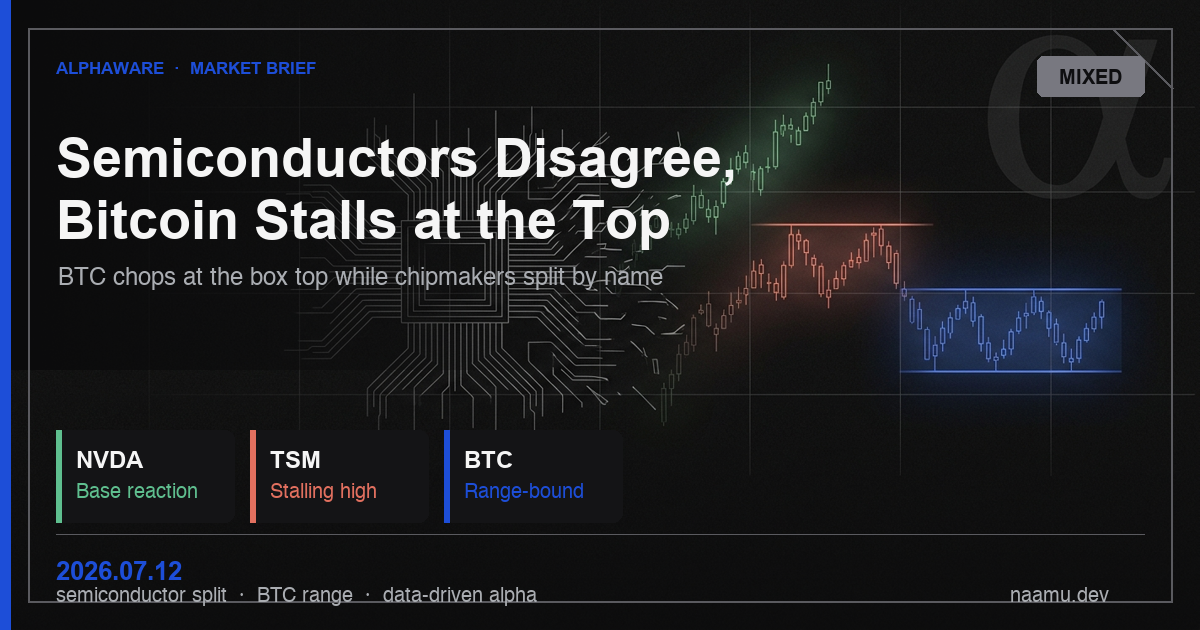
One line
The story today isn’t “up or down.” It’s different temperatures across assets.
Semiconductors don’t move as one, Bitcoin is stuck under a box ceiling, and dollar vs yields refuse a single risk narrative. This is a levels-first tape, not a trend call.
Bitcoin
BTC sat near the mid-64Ks on the capture—roughly a 61.6K–64.7K box. Lows showed selling that didn’t push price far; the top (~64.5K–64.7K) rejected upside tries more than once.
Candlestick labels are hints. What matters is whether volume and the actual range of the move agree. A real upside break needs noticeably higher volume, a wide push, and a hold. We don’t have that clean package yet—so call it box-top digestion, not a bullish regime shift.
| Levels | |
|---|---|
| Resistance | 64.5K–64.7K (repeated rejects) |
| Support | ~61.6K |
| Watch | Hold above the top → rewrite the box story · Lose 61.6K and fail to reclaim → door opens lower |
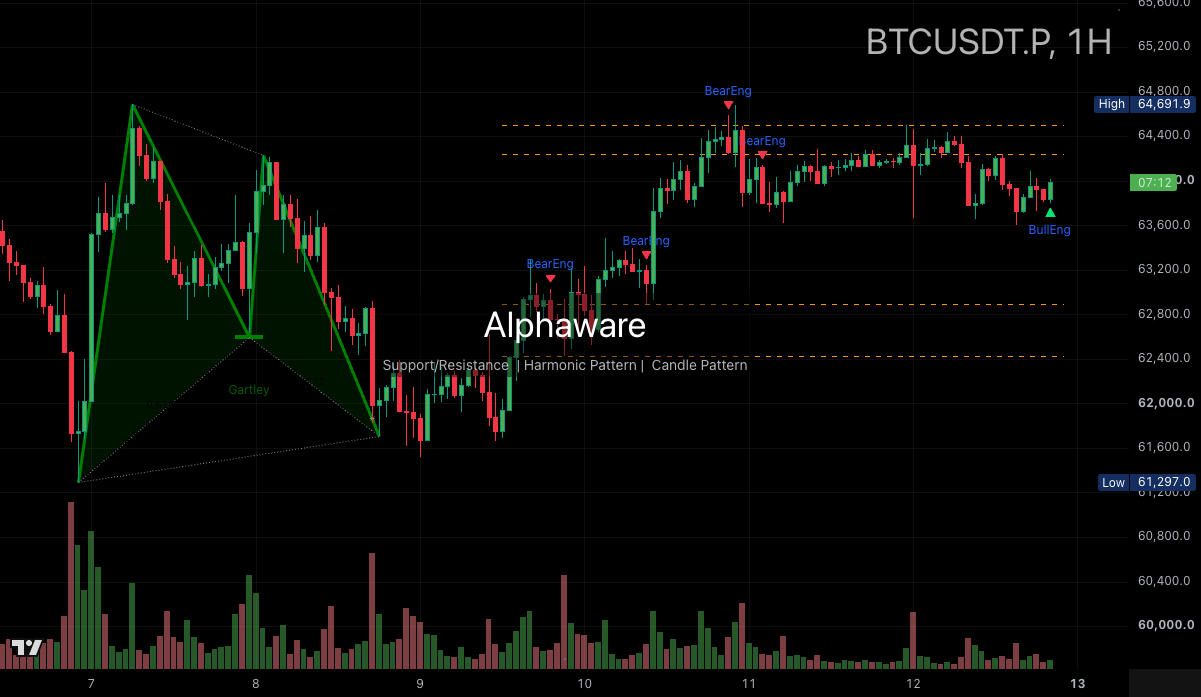
BTC: stalled under the box top—not a confirmed trend flip.
Semiconductors — same sector, different charts
NVDA looks closer to a low-area bounce candidate after a Bat-style low. Selling at the bottom didn’t fully follow through, but easy upside with clear volume isn’t locked in.
SK Hynix (000660) is similar: possible low digestion, still a weak bounce.
TSM is the split. After a long climb, highs keep failing—more high-area stall / supply pressure, with re-accumulation still possible after a long markup. Not a confirmed crash lower.
→ No “buy/sell all semis” line.
| Name | One line | Watch |
|---|---|---|
| NVDA | Low bounce candidate | Failed recovery after a low break vs volume on upside |
| 000660 | Low digestion, weak bounce | Low break / reclaim |
| TSM | High stall | Hold breakout high vs break of the range low |
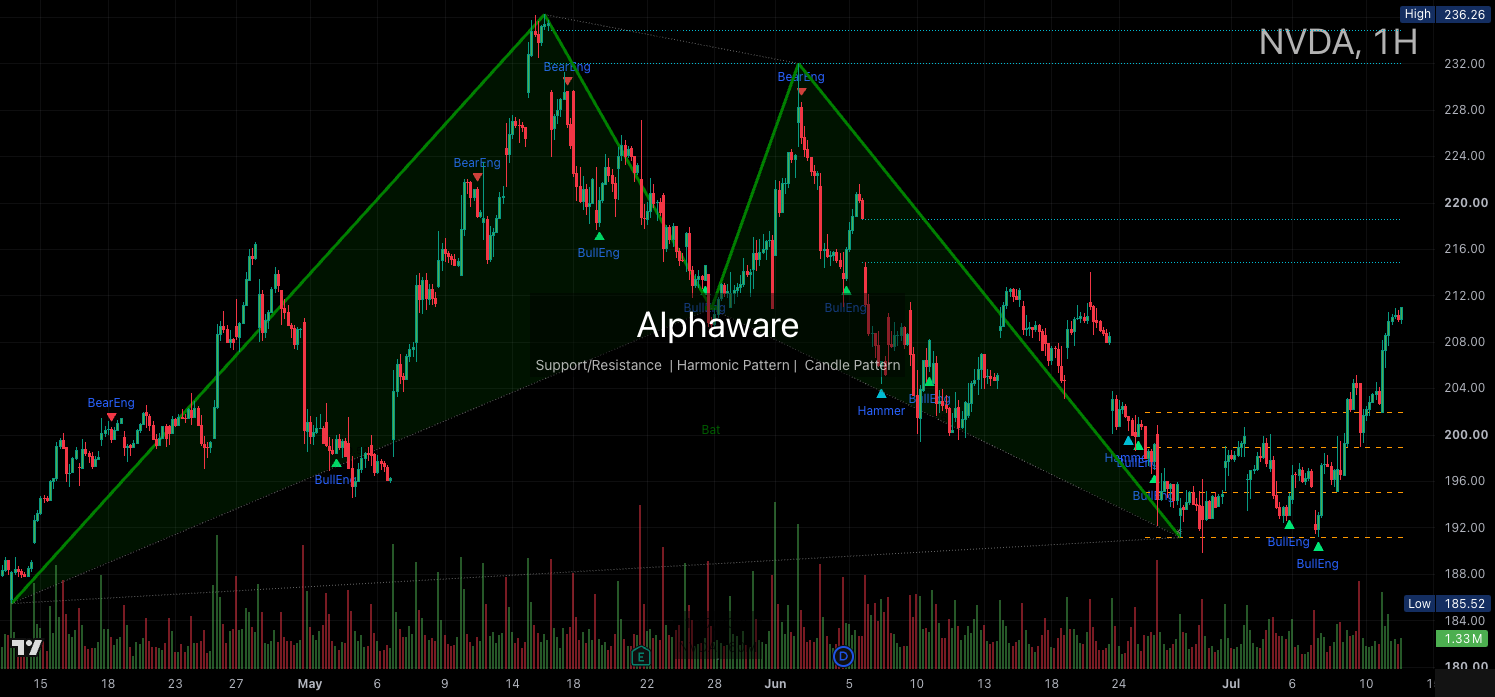
NVDA: response off the lows—not “already won.”
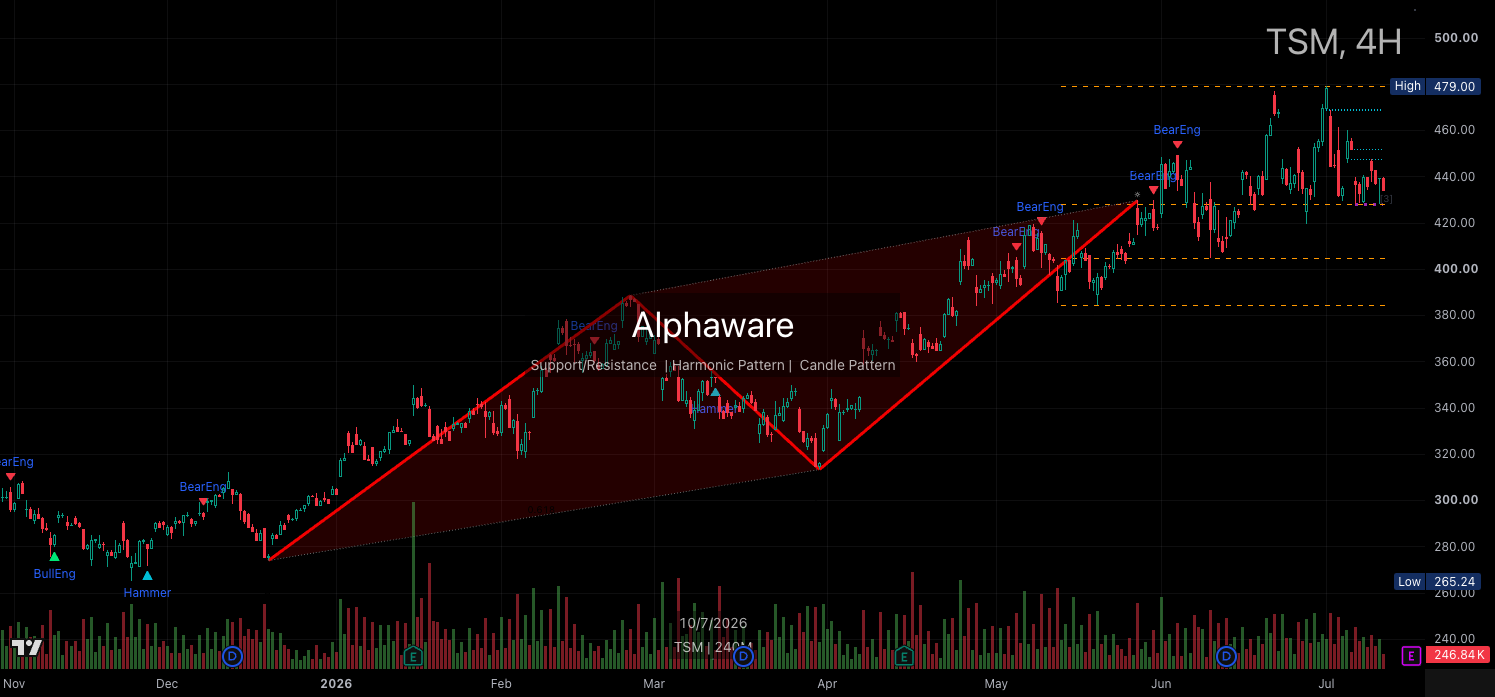
TSM: soft near the highs—different tape from NVDA.
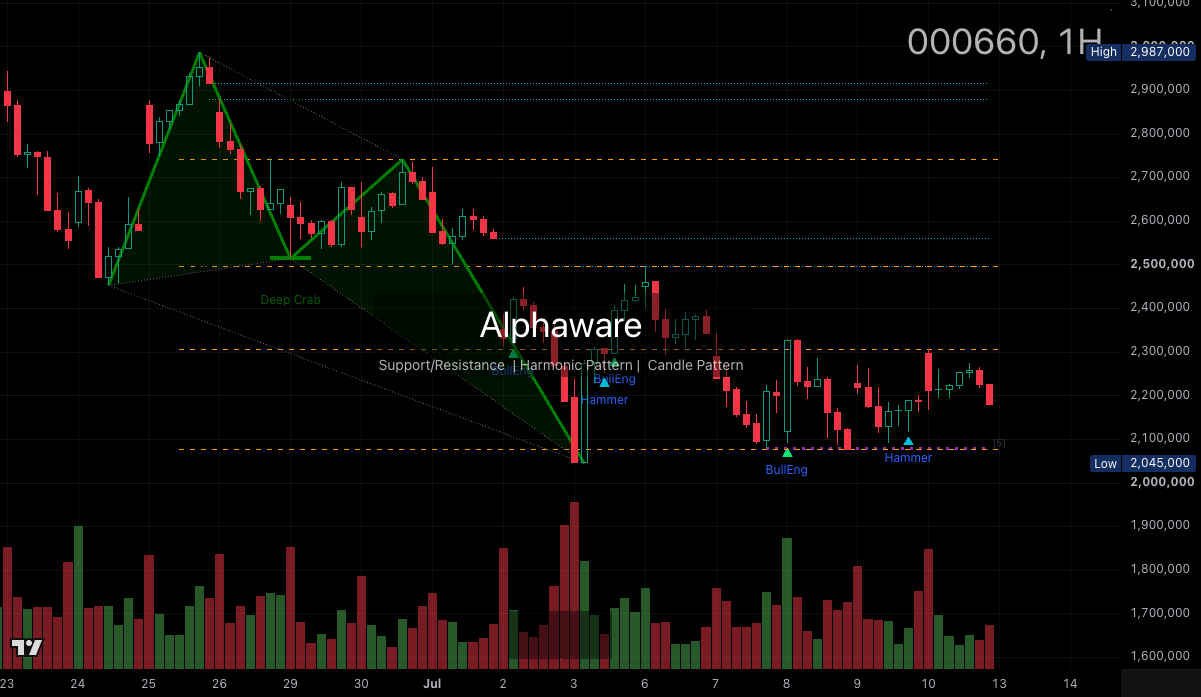
Hynix: low digestion candidate; bounce still thin.
Dollar, US 10Y, Japan 10Y
Don’t collapse these into “tightening” or “easing.”
For indices and yields, volume is often messy—structure and how far price travels matter more.
DXY — rejected near ~101.8, then chopped high. Not a one-way dollar bull.
US 10Y — bounced off the late-June low (~4.36%), then got rejected twice by shooting-star wicks in the 4.55–4.60% zone through early July. Currently sitting just below that, around 4.56%. Needs a held breakout to flip the read.
Japan 10Y — sharp move lower after the high. Don’t auto-sync with US yields.
| Watch | |
|---|---|
| DXY | Reclaim highs vs break lower (~100.5) |
| US10Y | Hold above 4.55–4.60% vs break of 4.36% |
| JP10Y | Bounce back to the high vs next leg down |
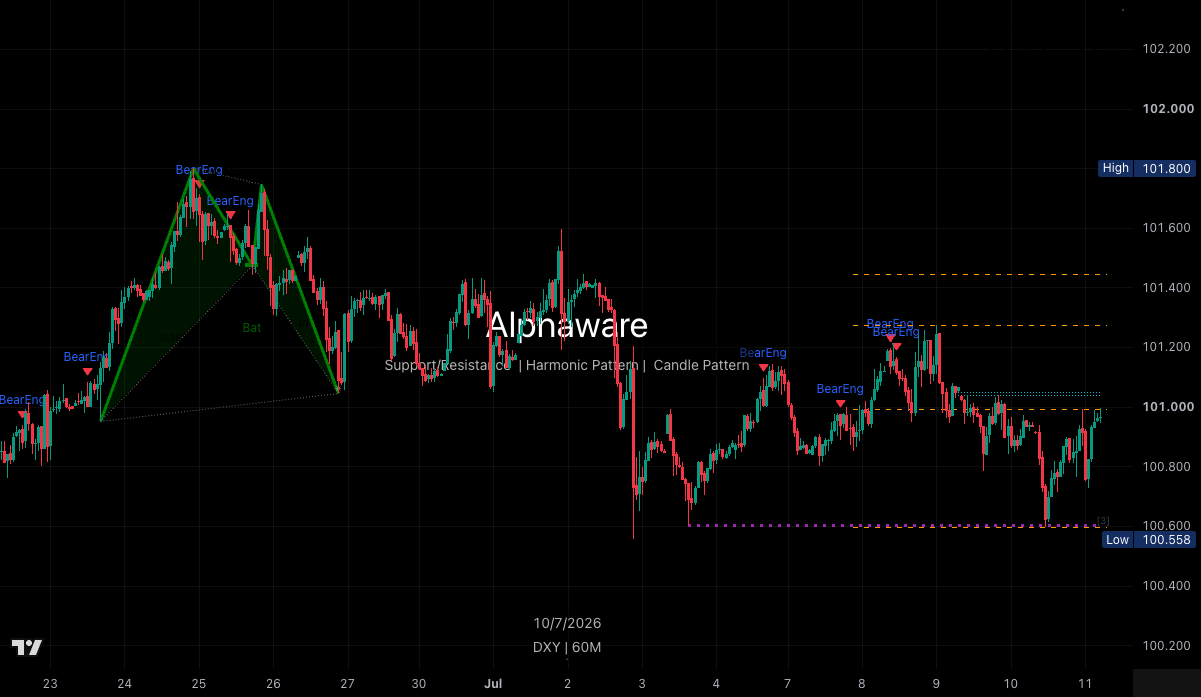
DXY: high rejection, still elevated chop.
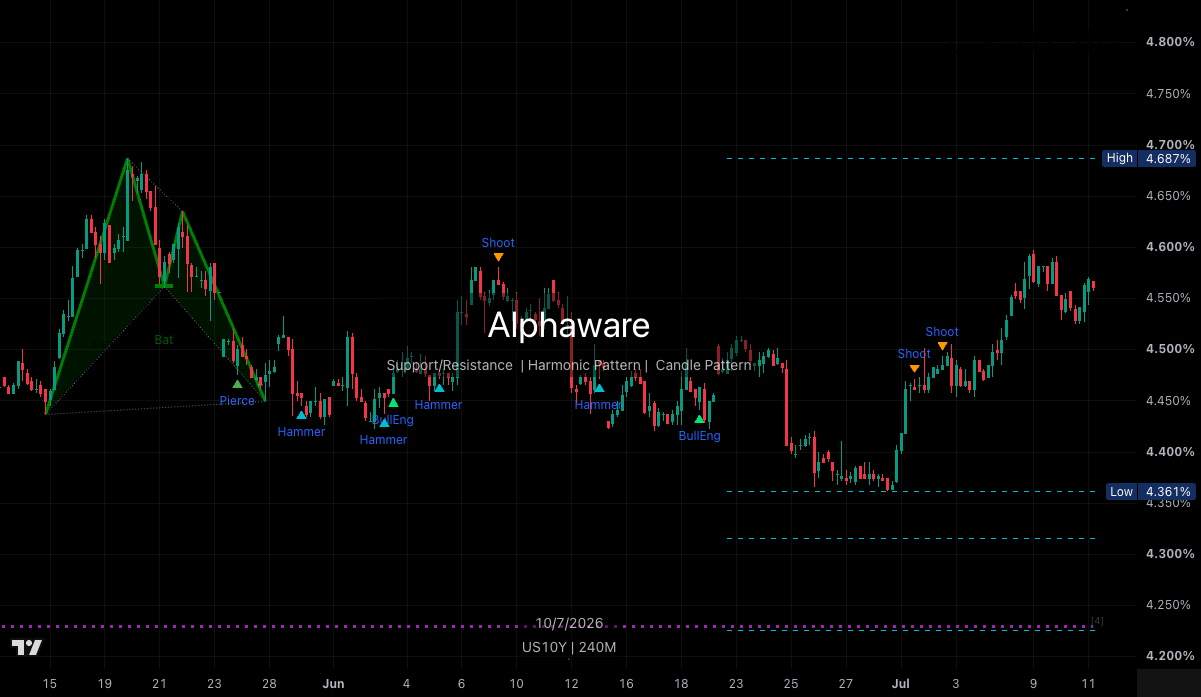
US10Y: rejected twice at 4.55–4.60% after bouncing off the 4.36% low. (4H)
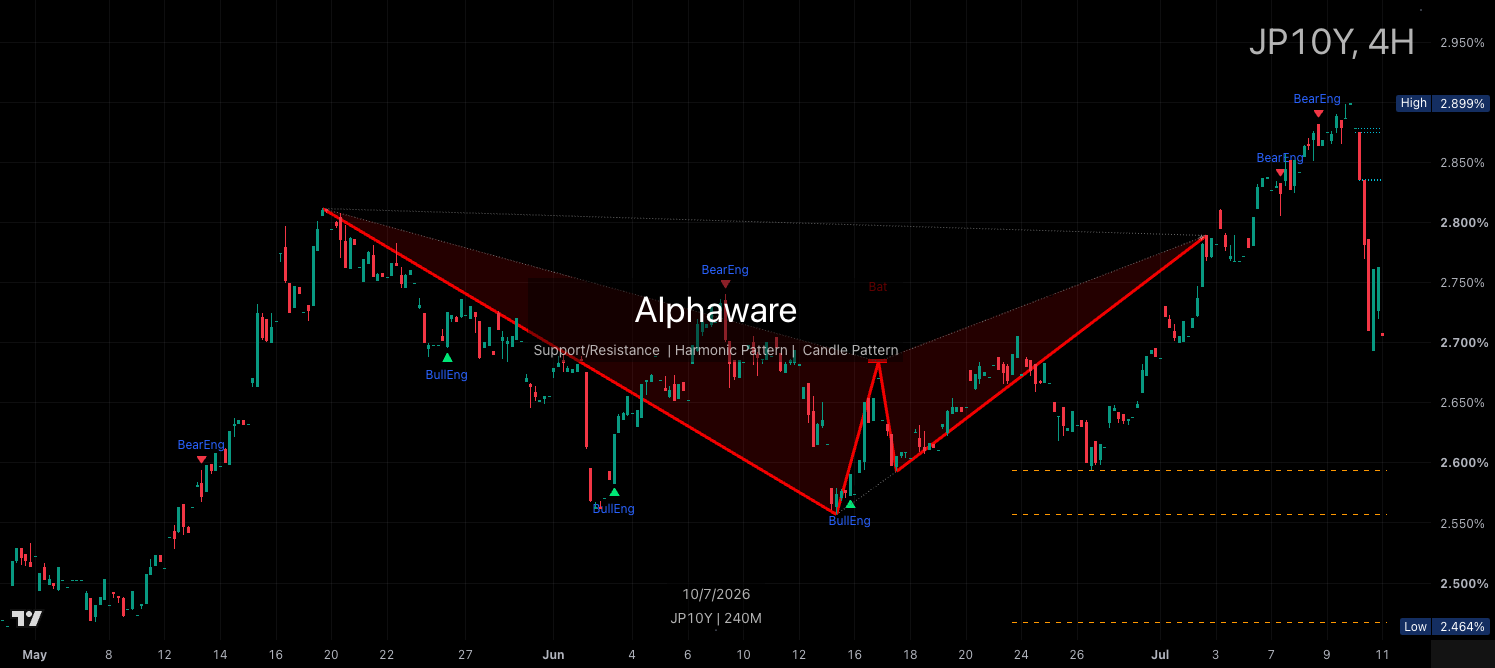
JP10Y: post-high drop—separate from US 10Y.
Scenarios — when we change the story
Base
BTC in the box, semis name-by-name, macro split. No big bets until levels break with effort.
Weight up if
- BTC holds above 64.5K–64.7K with volume
- NVDA/Hynix bounce continues with volume
Weight down if
- BTC loses 61.6K and doesn’t reclaim
- TSM breaks the high range lower with a wide push
A quick low sweep that snaps back is not automatic “game over”—it can be a shake then reclaim.
FAQ
Buy the whole semi complex?
No. NVDA/Hynix and TSM disagree on this tape.
Is Bitcoin going up?
It’s stalling under the box top. Call a break only with volume and a hold.
Macro in one sentence?
You can’t. DXY reject, US retest, JP drop—keep them separate.
This note is a same-day snapshot. Higher-timeframe alignment is not confirmed from this capture set alone.