Bitcoin traded at $83,593 at 14:33 UTC on 13 October. The 12 October daily candle closed at $81,850, with a low of $81,750. The 5 October high of $86,999 did not clear the September high, and the 8 October low was $80,394. The dollar reached 102.61 on 12 October and the 13 October quote is 102.27, still above 102. The US 10-year yield is off the 7 October high, but it has not left the low 5% area. Finishing a day above $80,000 is not enough to treat the decline as finished.
The Bitcoin quote is from 14:33 UTC on 13 October, or 23:33 KST. The 12 October daily candle is complete. The 13 October candle is still open. The dollar quote is from 14:23 UTC and the Treasury quote from 14:18 UTC. The charts below are the saved layouts opened on 12 October, so they do not show the 12 October close or the 13 October session. The previous brief is the 4 October jobs and yields check.
$87k was rejected again
The 21 September spot high was $87,396. The 4 October daily candle closed at $86,530, and the next session’s high was $86,999. Both stayed under the September high. On 7 October price lost the 2 October low of $83,888. The 8 October low was $80,394. The 20 September low of $80,126 is still intact.
The 11 October high was $84,199 and the close was $83,773. On 12 October the high was $84,352, the low $81,750, and the close $81,850. The 13 October daily candle is unfinished. So far the high is $84,168 and the low is $81,034. The 14:33 UTC print is $83,593. Both the 12 October low and the 13 October low are above the 8 October low. The highs on 11, 12, and 13 October traded back above $83,888, but the 11 and 12 October closes, and the 13 October quote, are under it.
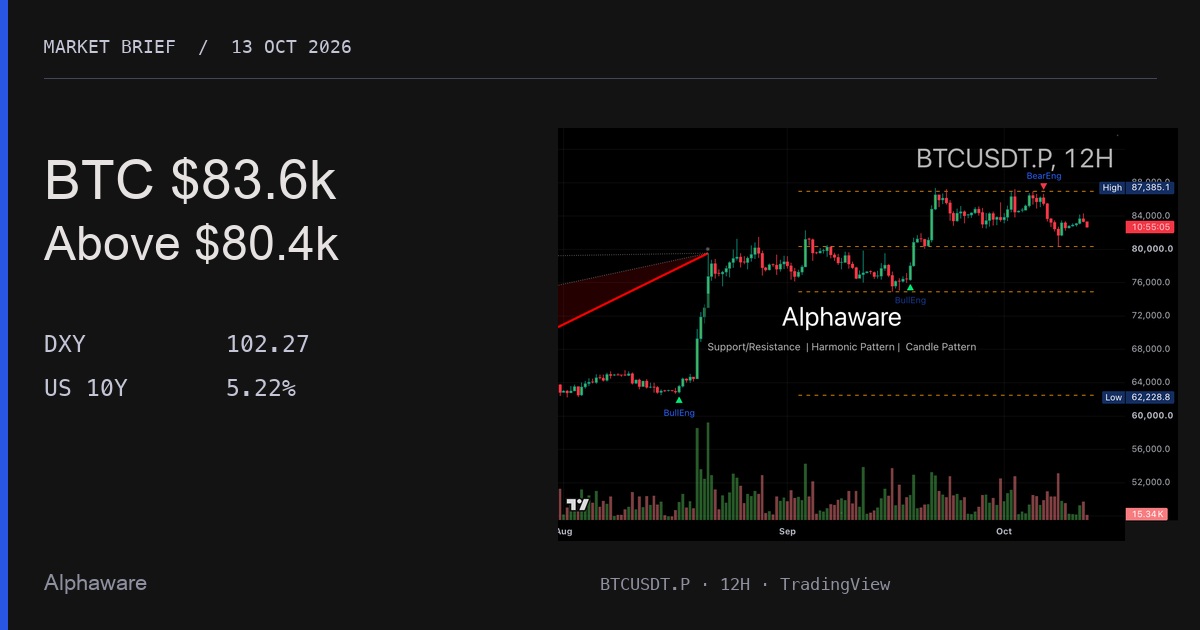
The saved 12-hour perpetual chart tests the high label 87,385.1 twice and does not hold above that line. Price then falls back to the $80,000 grid line. Earlier in September it had already tagged the $76,000 line and rallied to the high. This decline has not touched $76,000 again. The right edge of the picture is above $80,000 and below the $84,000 grid. The high line has not turned into support. The label 87,385.1 is not the 21 September spot high. The $80,000 line sits just under the 20 September and 8 October spot lows. The low label 62,228.8 is the base before the August surge, not the low of this decline. The layout stamps a candle mark on the high. The call rests on the failure to hold that line, not on the name of the mark.
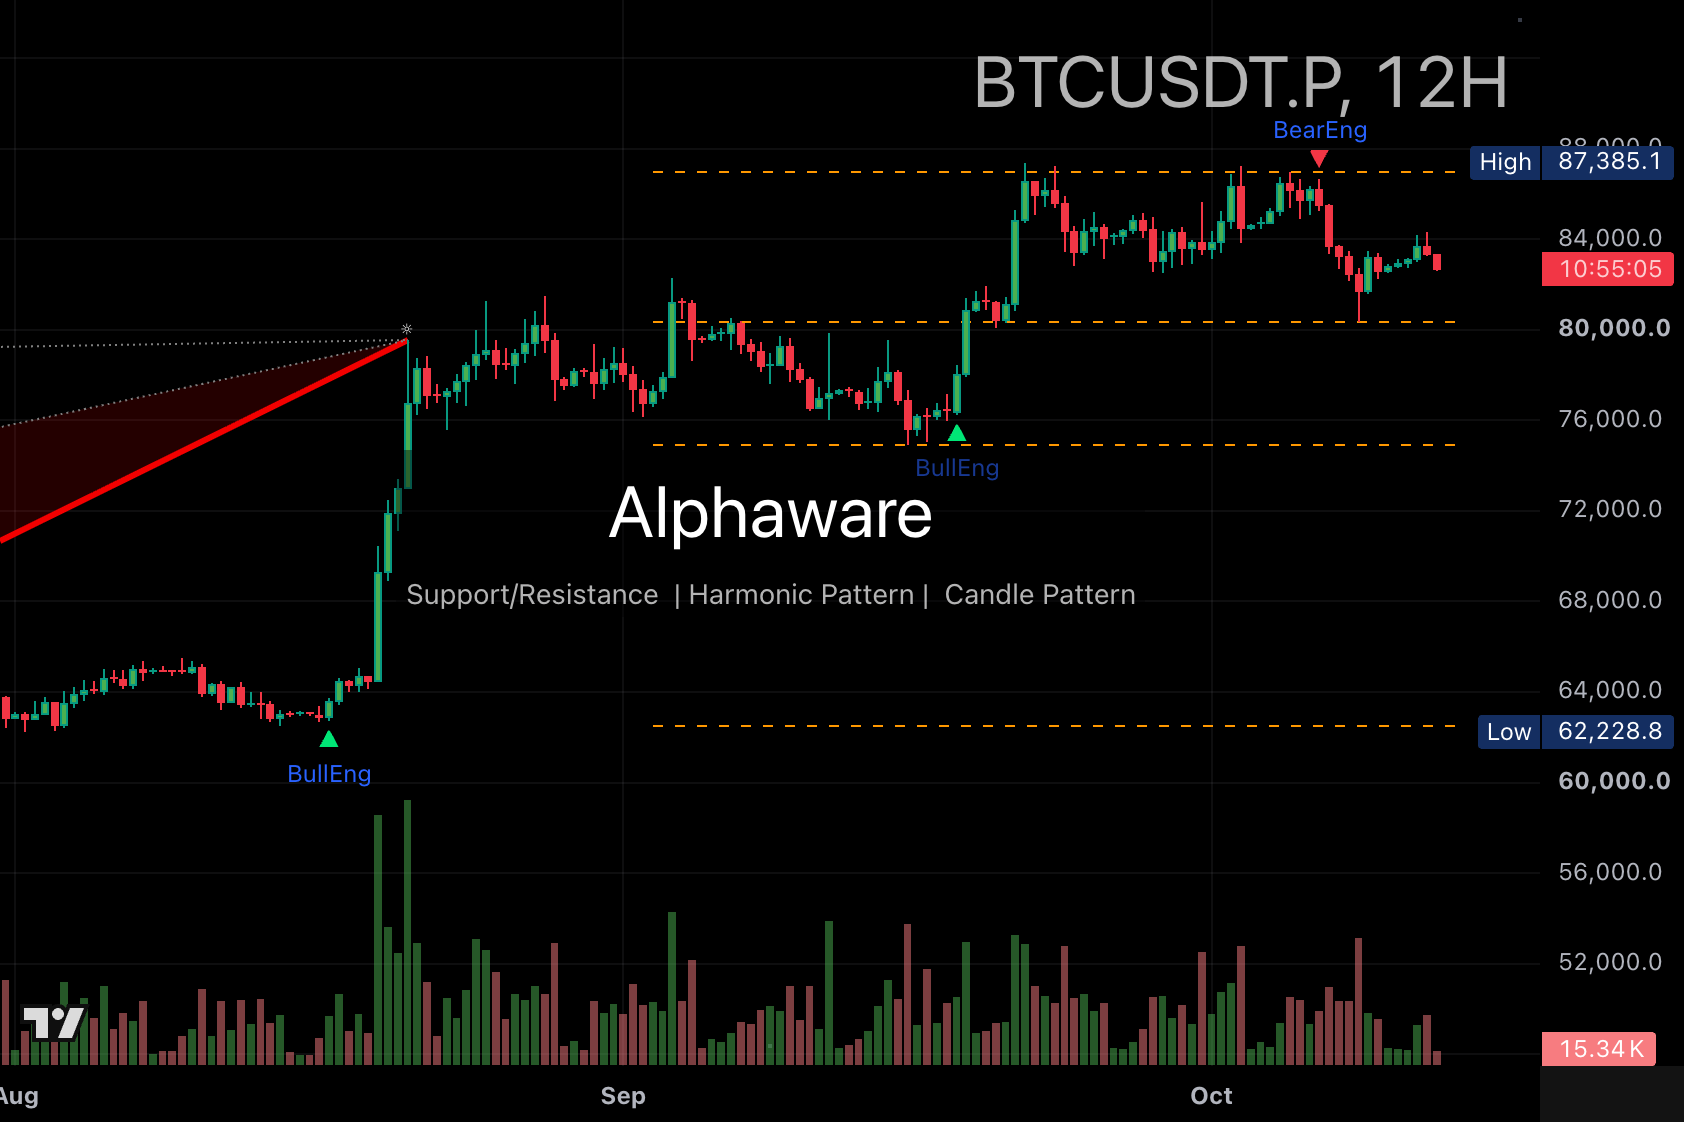
TradingView · BTCUSDT perpetual, 12-hour. Captured 2026-10-12. The labels 87,385.1 and 62,228.8 belong to this layout. The horizontal lines sit on the $80,000 and $76,000 grid marks. This image does not show the 12 October close or the 13 October session. $81,850 is the 12 October spot close, $83,593 is the 14:33 UTC spot print on 13 October, and $80,394 is the 8 October spot low.
The dollar cleared 102.54, then eased
The dollar index rose to 102.54 on 5 October and closed at 102.21 on 9 October. On 12 October it took out that high, with a high of 102.61 and a close of 102.58. The 14:23 UTC quote on 13 October was 102.27. That is back under the 5 October high, and it is still above 102. The 13 October dollar candle is still open.
The 12-hour layout is a climb from the September low label 98.557, with higher lows along the way. It does not return under that low. The right edge is pressed against the high label 102.535 and still above 102. The picture stops before that high line gives way. The 12 October daily high of 102.61 came later and cleared the label. The 13 October quote, 102.27, is back between 102.535 and 102. The next chart question is whether 102.535 is taken again, or whether price closes under 102.
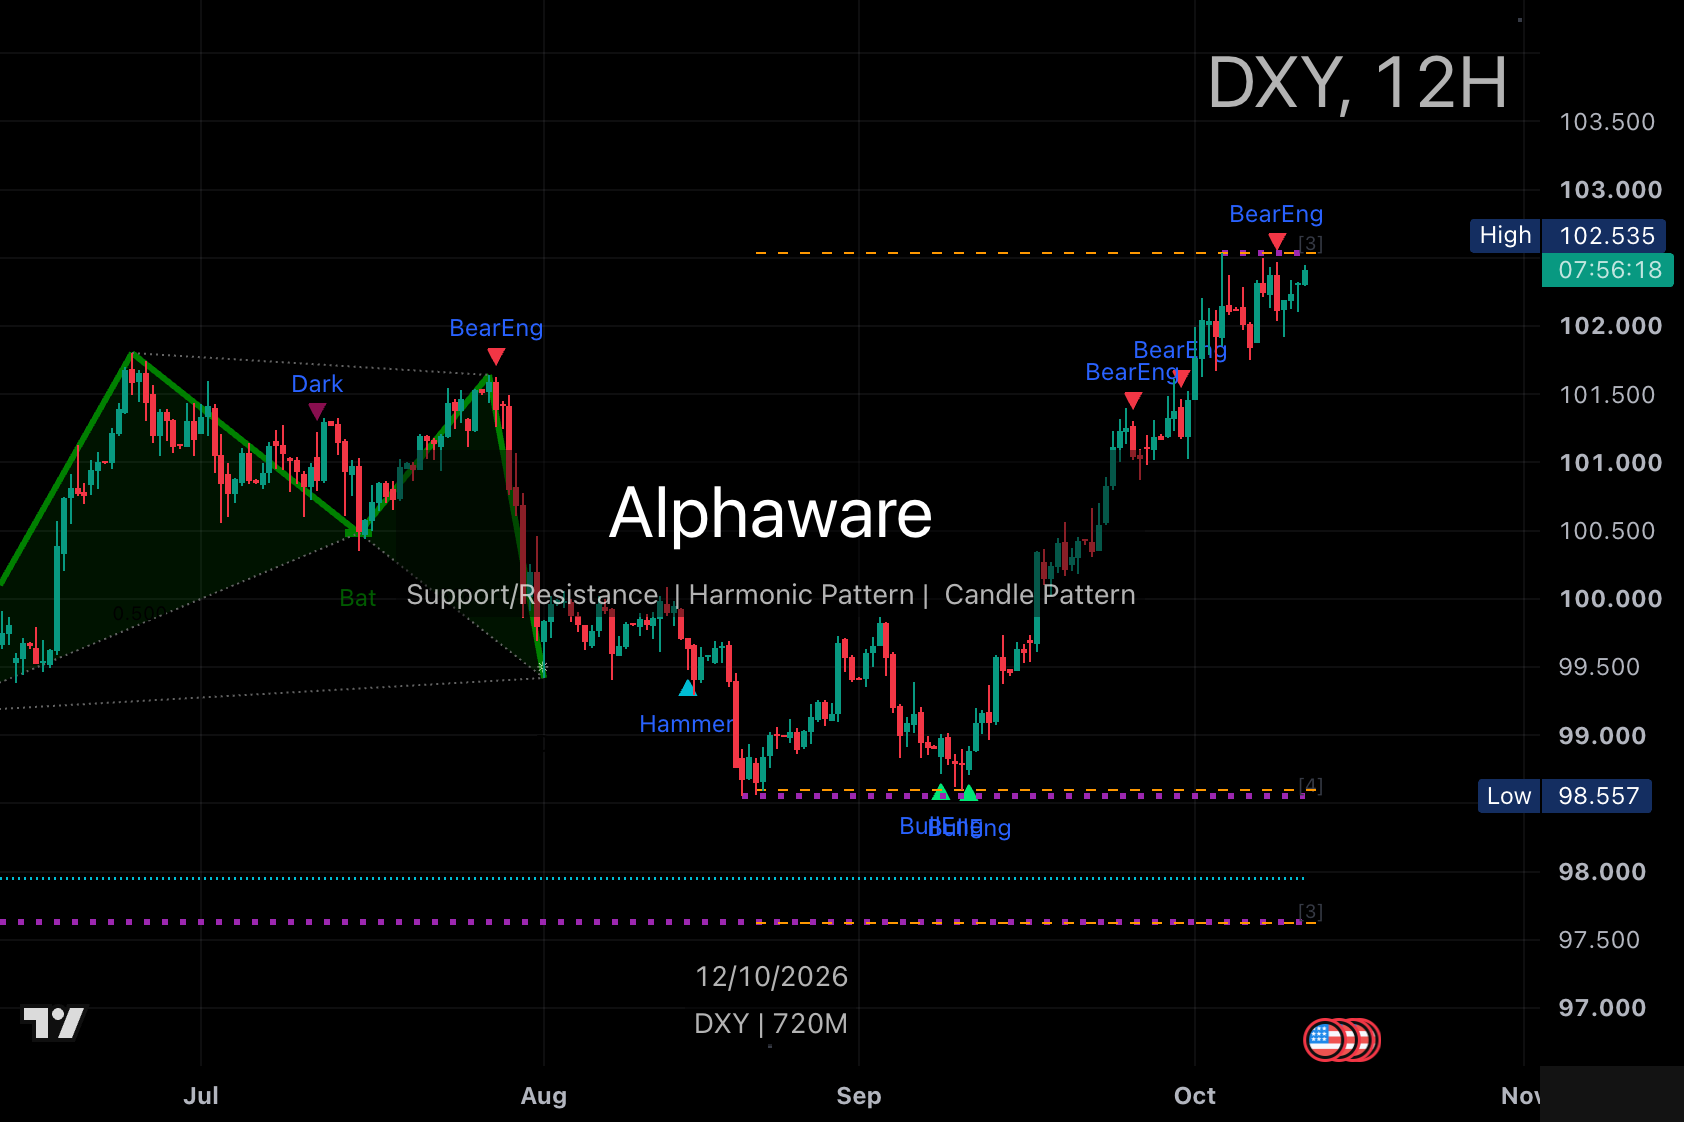
TradingView · DXY, 12-hour. Captured 2026-10-12. The labels 102.535 and 98.557 belong to this layout. 102.54 is the 5 October daily high and 102.21 is the 9 October daily close. 102.61 and 102.58 are the 12 October daily high and close, and they are not the layout’s high label. 102.27 is the 14:23 UTC quote on 13 October.
The US 10-year is off 5.36%, still above 5.2%
The US 10-year yield reached 5.364% during the 7 October session. The saved layout’s high label is 5.365%. The 9 October close was 5.244%, and the 14:18 UTC quote on 13 October was 5.223%. That is below the 7 October high, and it is not a large step down from the 2 October close of 5.277%. The 13 October yield candle is still open. The 12 October Yahoo daily bar printed 5.240 for the high, low, and close, so it is not used as that day’s range.
The 1440-minute chart breaks through 5.000%, runs to the high label 5.365%, and gives the first red candle back toward the 5.200% grid. That candle does not go through 5.200%, and no candle on this picture goes back under 5.000%. The window low label 3.860% is not the low of this pullback. The 13 October quote, 5.223%, is still above 5.200%. A break of that grid would deepen the pullback. A return through 5.365% would leave the red candle as a pause at the high.
The day the yield made its high and the day Bitcoin printed $80,394 were not the same day. Price after the 8 October low has traded with the yield already under 5.36%, but the yield itself has not returned to a low range.
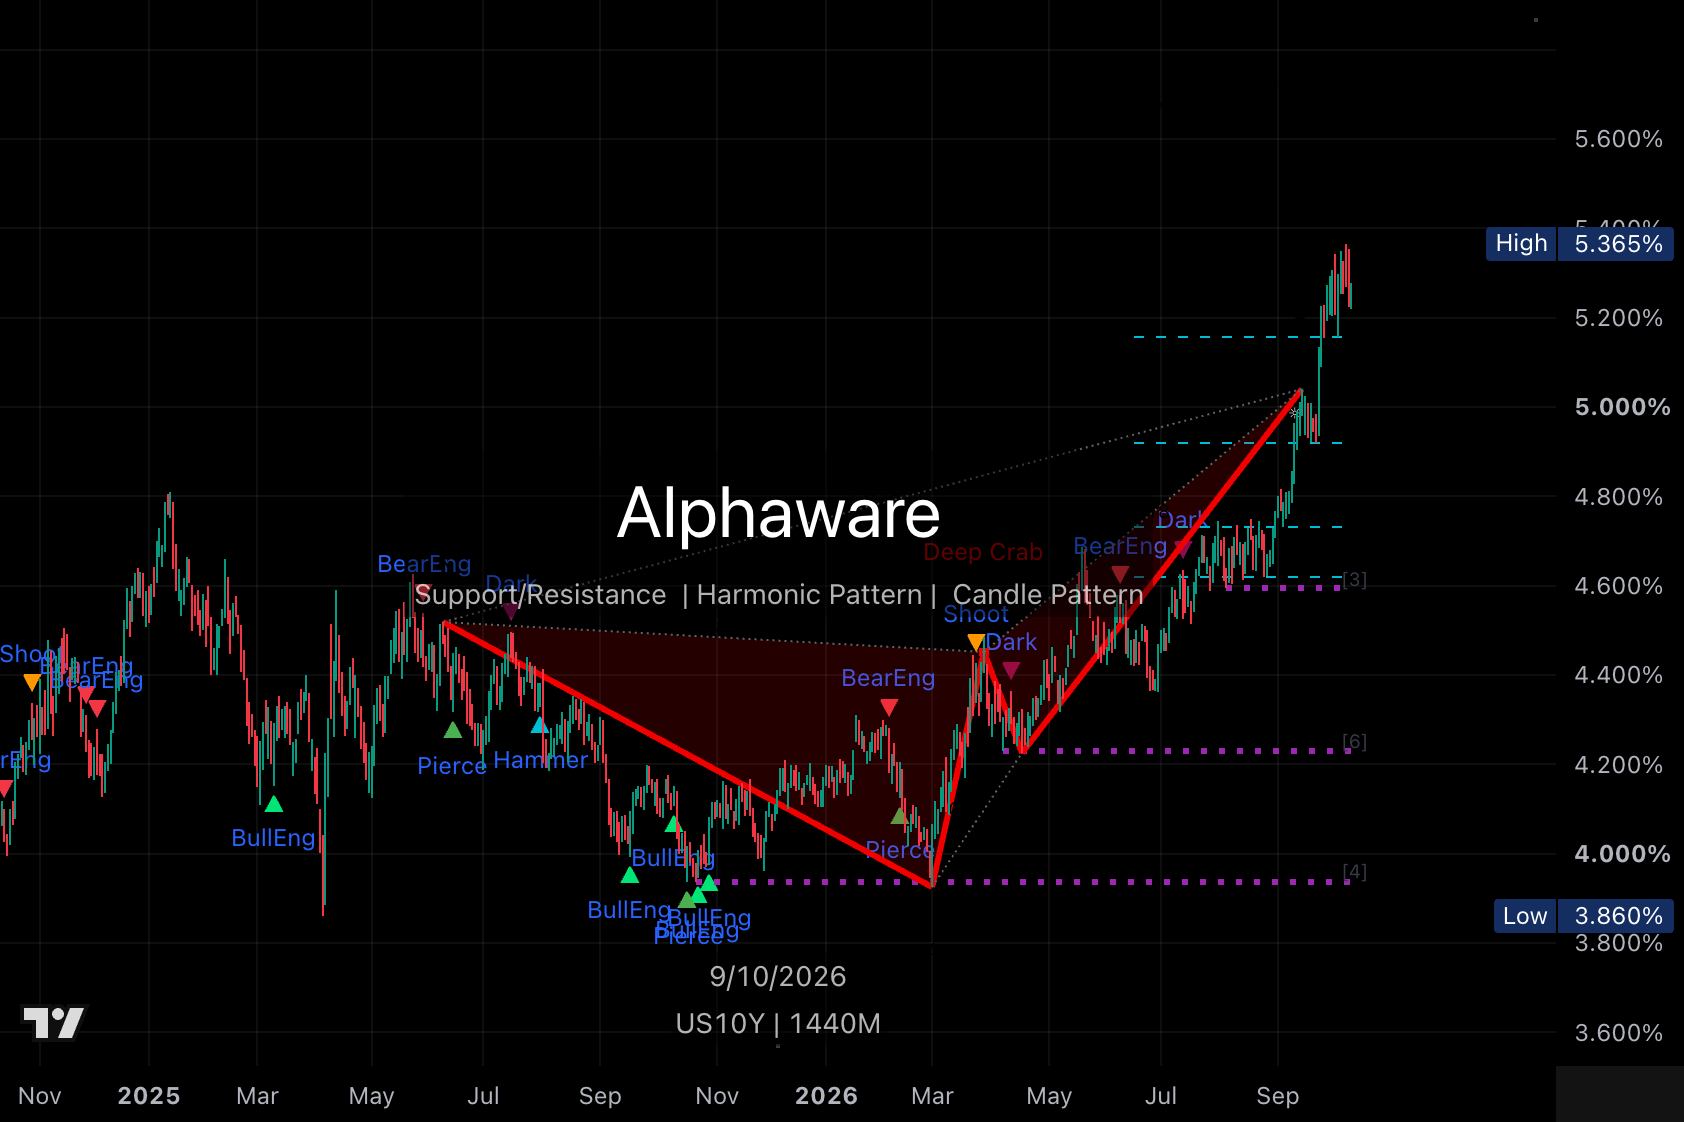
TradingView · US10Y, 1440-minute label on the chart. Captured 2026-10-12. The labels 5.365% and 3.860% belong to this layout. 3.860% is not the low of this decline. 5.364% is the 7 October daily high, 5.244% is the 9 October daily close, and 5.223% is the 14:18 UTC quote on 13 October.
Holding near $80k comes first
The stance is mixed. On the charts, Bitcoin has failed to hold the high line and is back above $80,000, the dollar is pressed against 102.535, and the US 10-year has pulled back toward the 5.200% grid. A recovery that reclaims $83,888 and stays there, with the dollar remaining under the 12 October high of 102.61 and the US 10-year holding above 5.200% without taking out 5.365%, would give the bounce after the $80k test more support.
Losing $80,394 and the 20 September low of $80,126 would bring the $76,000 line drawn on this chart into view. The figures below are comparison points from recent trading and this chart, not orders or targets.
| Bitcoin spot | What it marks |
|---|---|
| $87,396 | 21 September high. Different from the layout label 87,385.1 |
| $86,999 | 5 October high. Where this bounce stalled |
| $83,888 | 2 October low. The 11–13 October highs traded above it. The 11 and 12 October closes, and the 13 October quote, are back under it |
| $81,850 | 12 October close. That day’s low was $81,750 |
| $80,394 | 8 October low. The low of this decline. The 13 October low is still above it |
| $80,126 | 20 September low. The comparison if $80,394 fails |
What to watch into CPI
September CPI is released at 21:30 KST on 14 October. The next FOMC meeting is 27–28 October. BLS release schedule, FOMC calendar
Until then, the question is not a new high. It is whether Bitcoin holds the $80,000 line on this chart, whether the dollar leaves 102.535 toward the 12 October high of 102.61 or back through 102, and whether the US 10-year holds the 5.200% grid.
Sources: Past Bitcoin levels are completed Binance BTCUSDT spot daily candles in UTC, rounded to the dollar. The 12 October candle is complete. The 13 October candle was still open at 14:33 UTC. USDT is pegged to the dollar and can differ from a dollar spot print. Daily dollar and yield values, and the 13 October quotes, use Yahoo Finance DXY and the US 10-year. Dollar figures are rounded to two decimals. The 12 October Yahoo yield bar is not used as a range. The charts are the saved layouts opened on 2026-10-12. BTC is the 12-hour perpetual, DXY is 12-hour, and US10Y is the 1440-minute label on the chart.