One line
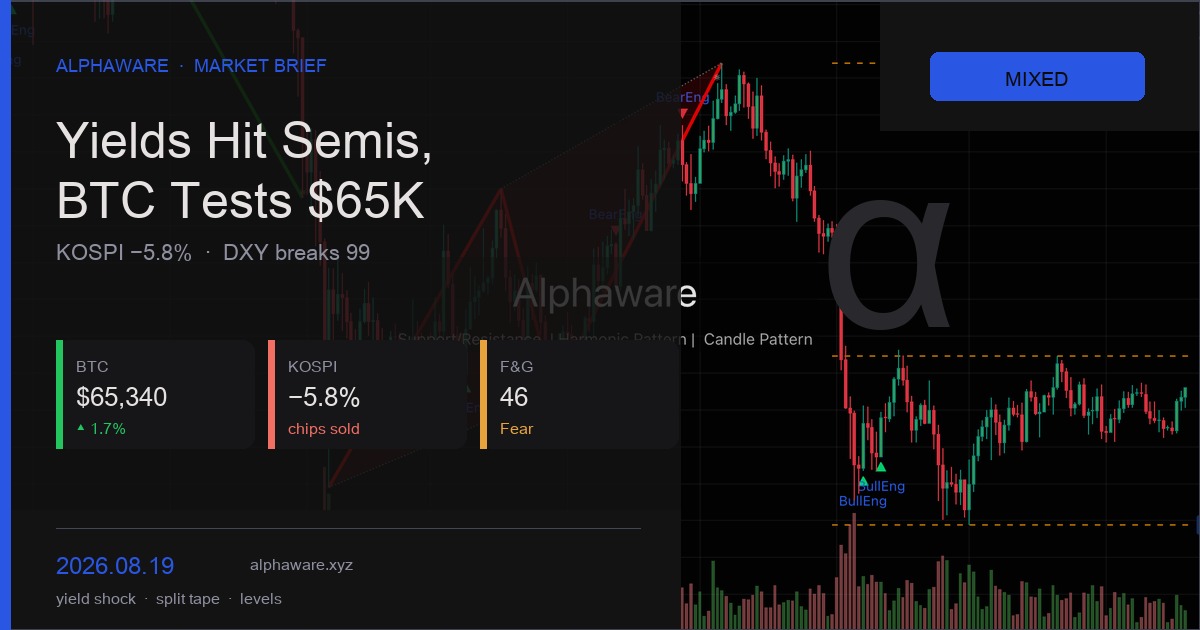
Today’s tape is not a single risk-on or risk-off line. Korean semiconductors took the long-yield hit first, the dollar slipped below 99, and bitcoin is retesting $65,000 in the middle of a 62K–67K box. This is a levels session, not a trend call.
Snapshot: around 23:00 KST on 19 August 2026. The Korean cash session is closed. US cash, the dollar, and yields are still live.
Bitcoin
BTC is about $65,340, +1.7% over 24 hours, inside a $64,166–$65,440 day range. On the daily chart the post-June box still runs roughly 58K–67K. The latest swing low is $62,535 on 14 August. Price is mid-range, not a breakout.
A poke through $65,000 is not a regime shift. The story changes higher only if ~$67,000 is cleared and held. It leans lower if $65,000 fails and the 62K area is not reclaimed.
Volume is lighter than the June collapse. A green candle with little effort behind it is still movement inside the box.
| Levels | |
|---|---|
| Resistance | ~$67,000 (box top, repeated rejects) |
| Pivot | $65,000 (hold vs lose-and-fail-to-reclaim) |
| Support | ~$62,500 (August swing low) |
| Floor | ~$58,000 (post-June box low) |
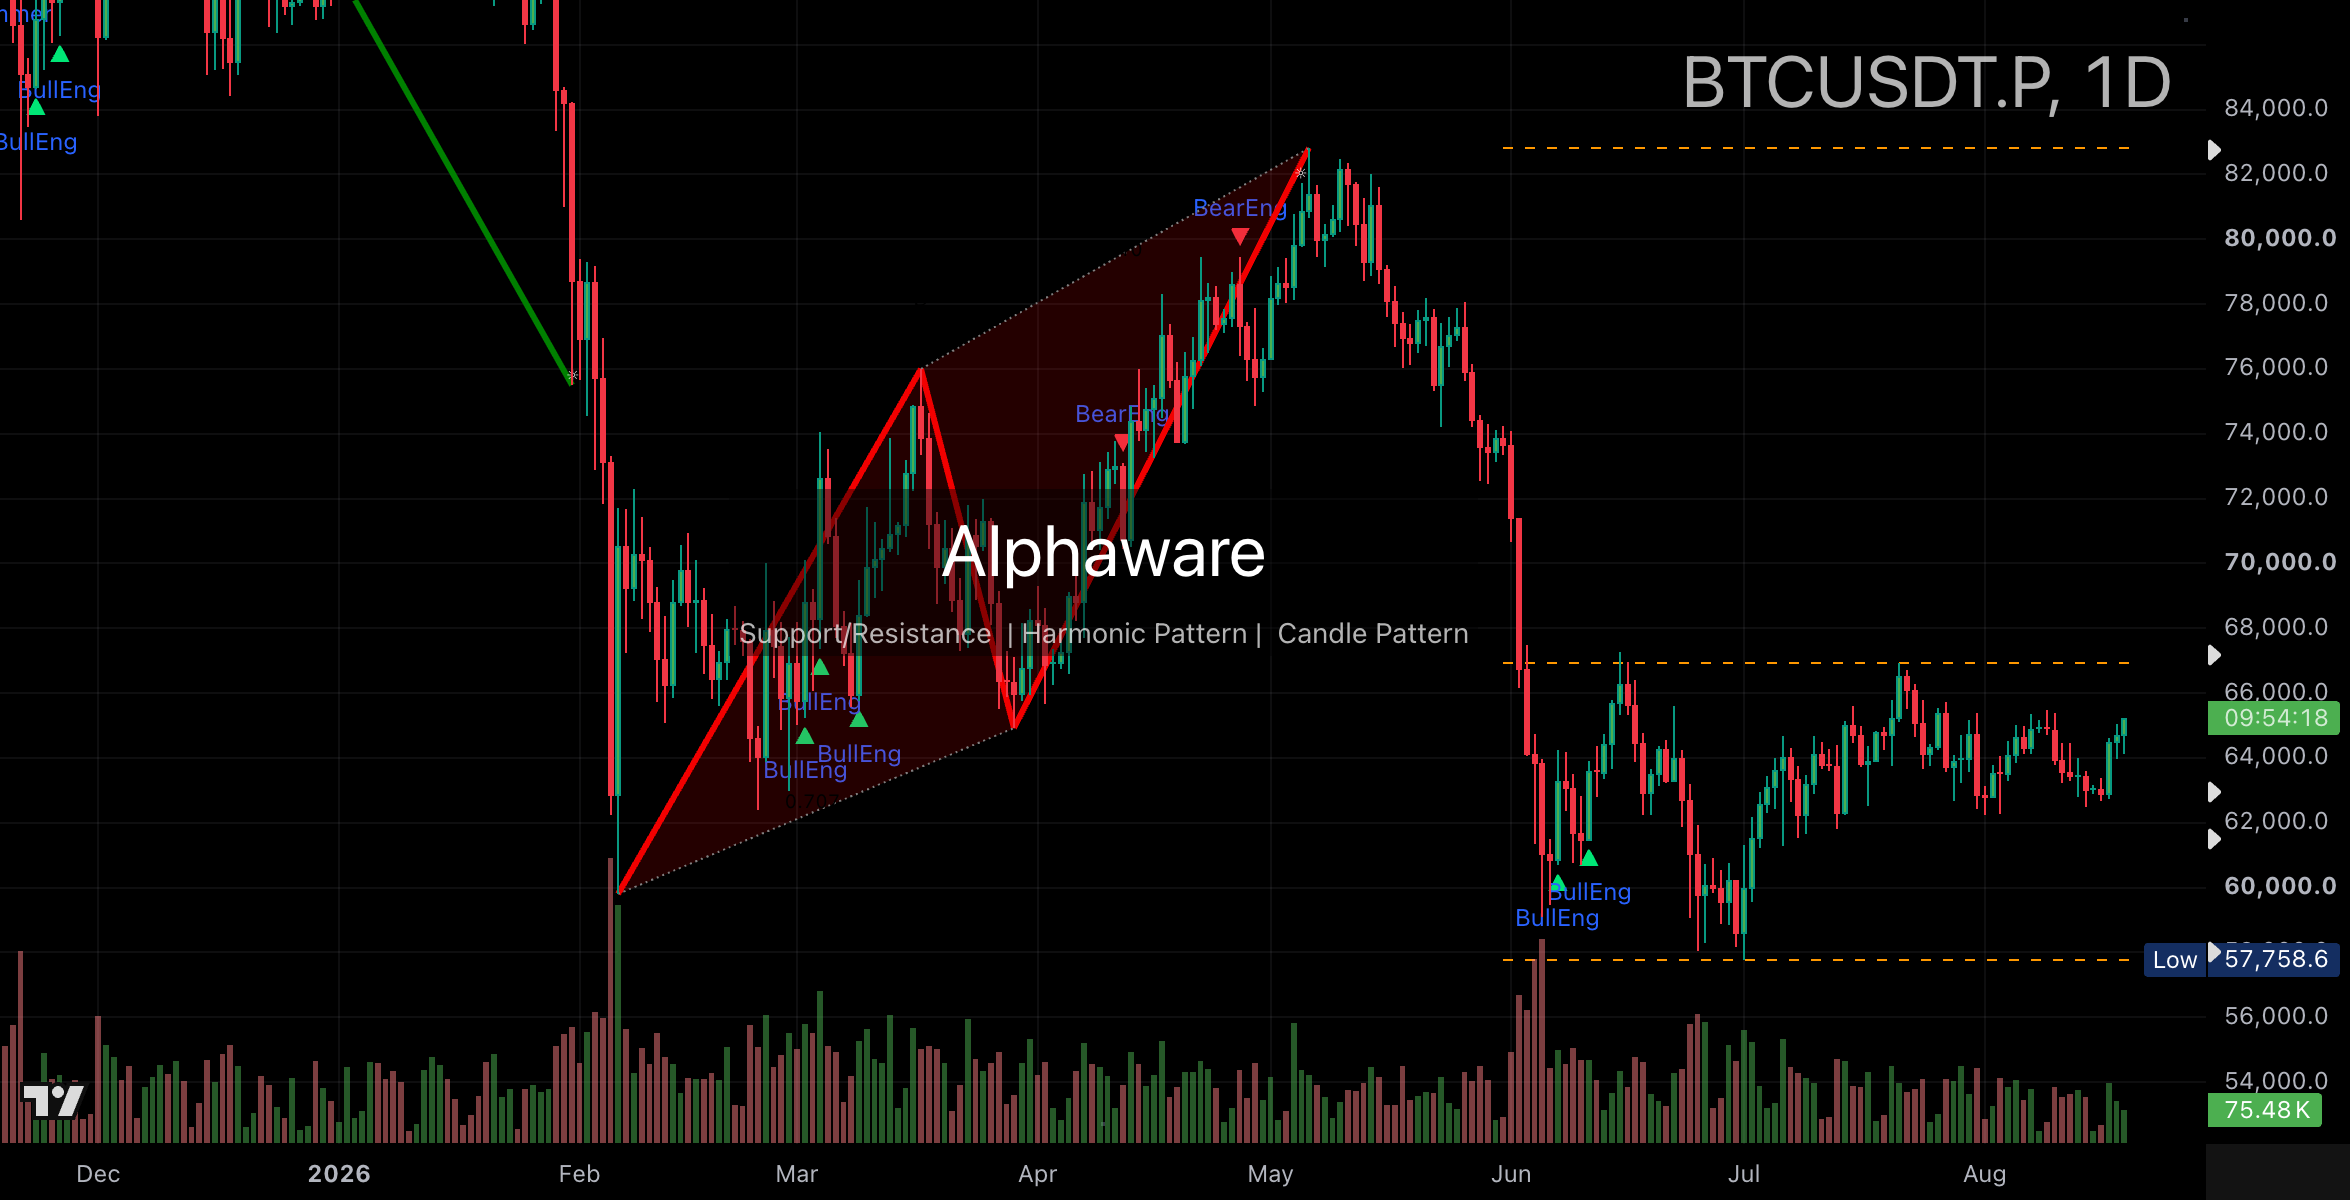
BTC daily: still mid-box until 67K is recovered and held.
Semiconductors — Korea sold, the US and Taiwan did not rhyme
KOSPI closed 6,471.17, −5.80%. Intraday volatility was large enough for a program-selling sidecar. SK Hynix finished KRW 1,500,000, −9.75%. Samsung Electronics closed KRW 247,500, −7.82%. Memory was hit harder than the index.
The impulse looks more like duration than a one-line earnings miss. When the risk-free rate jumps, AI and semiconductor multiples that discount distant cash flows move first. Overnight weakness in Micron, Sandisk, and the Philadelphia semiconductor index carried into the Korean open.
Nvidia is a different tape. On the 1-hour chart it rejected ~$228 and is testing a $218 shelf. That is not the same as Hynix losing a day’s structure. TSMC has come down from a $479 high, failed to reclaim $435, and is sitting on $405–$411. Next line: ~$375.
Do not write a single buy/sell sentence for “semis.” Korean memory already took the hit. NVDA and TSM are still defending their own levels.
| Name | Read | Watch |
|---|---|---|
| 000660 | Sold to KRW 1.50M | A break of KRW 1.35M that does not reclaim opens a retest of the July low (~1.25M) |
| NVDA | $228 rejected, $218 on trial | Lose $218 and fail to return / hold above $228 and the reject fades |
| TSM | Failed $435, holding $405–$411 | Break of support points to $375 / a held reclaim of $435 weakens the down case |
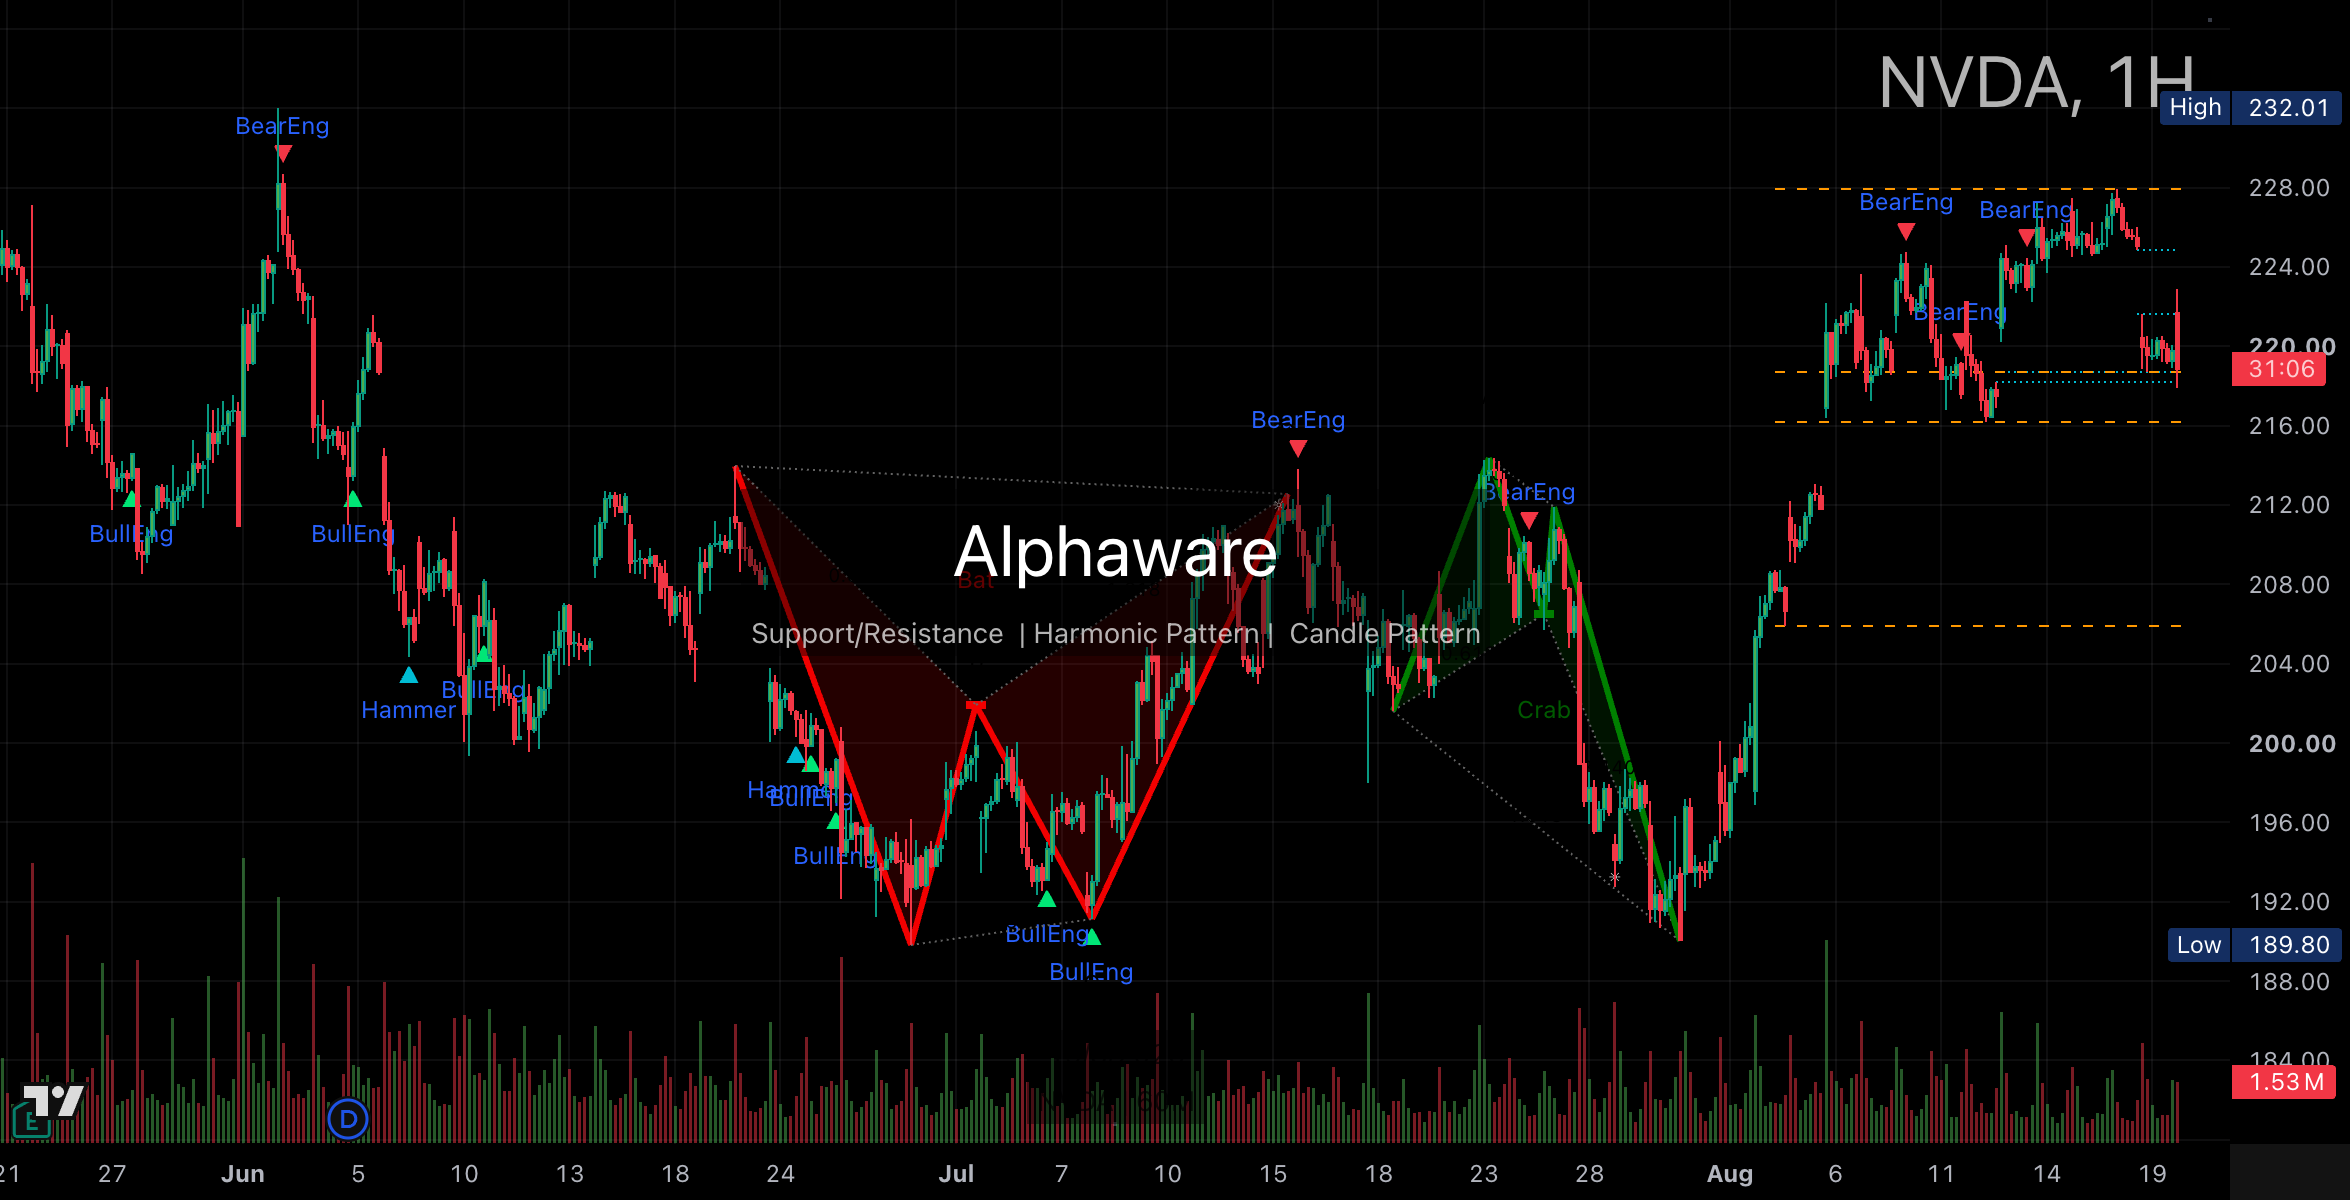
NVDA: a support test after a high-side reject, not a Hynix-style air pocket.
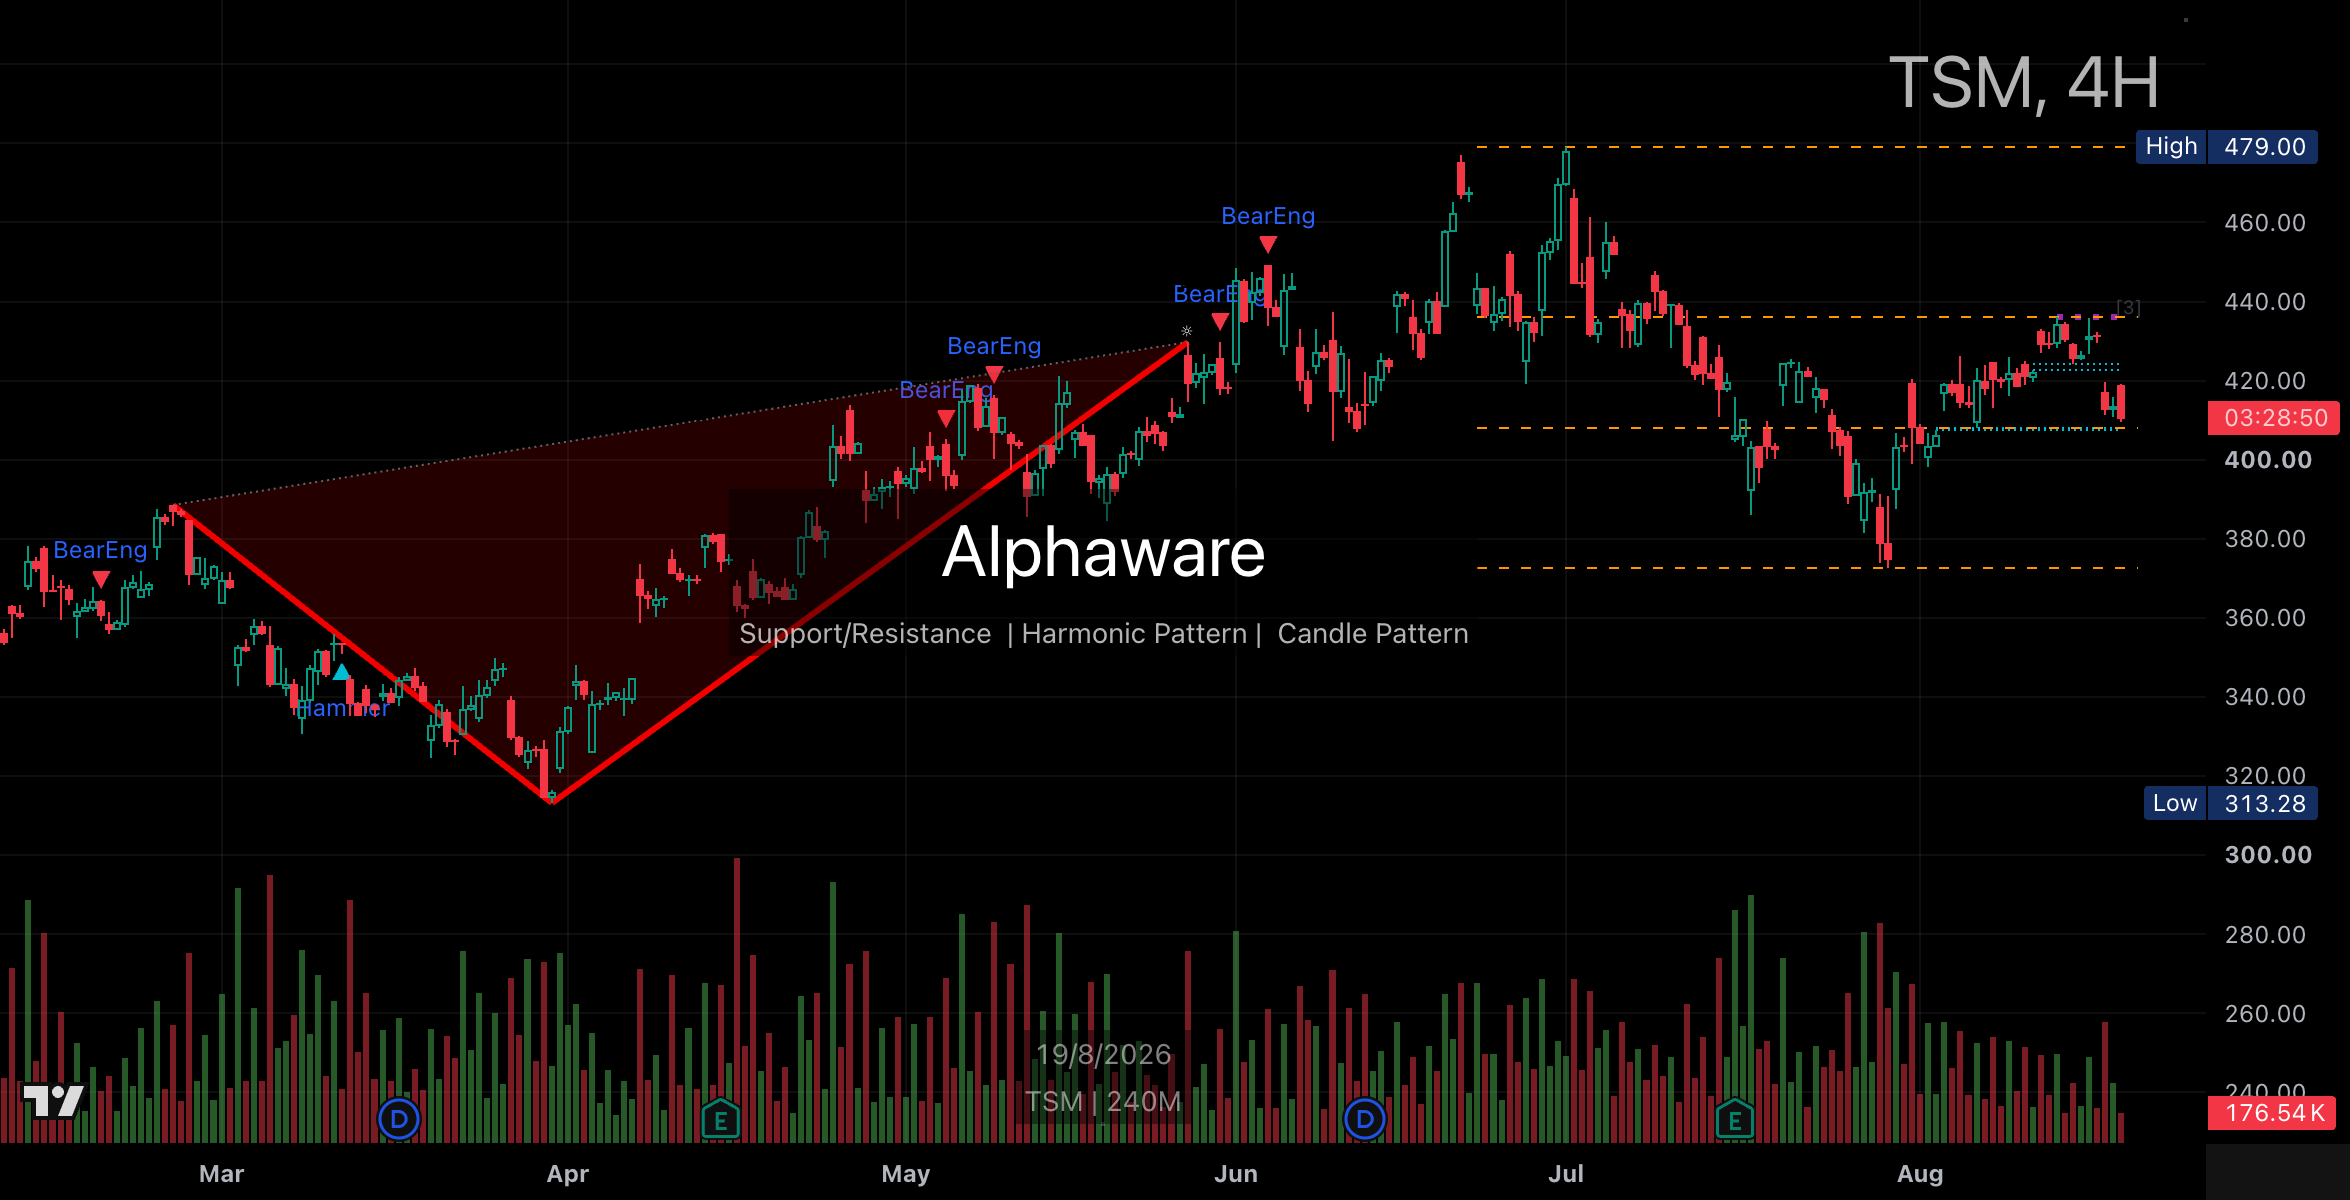
TSM: digesting the high, sitting on mid-range support. Not today’s Korean memory candle.
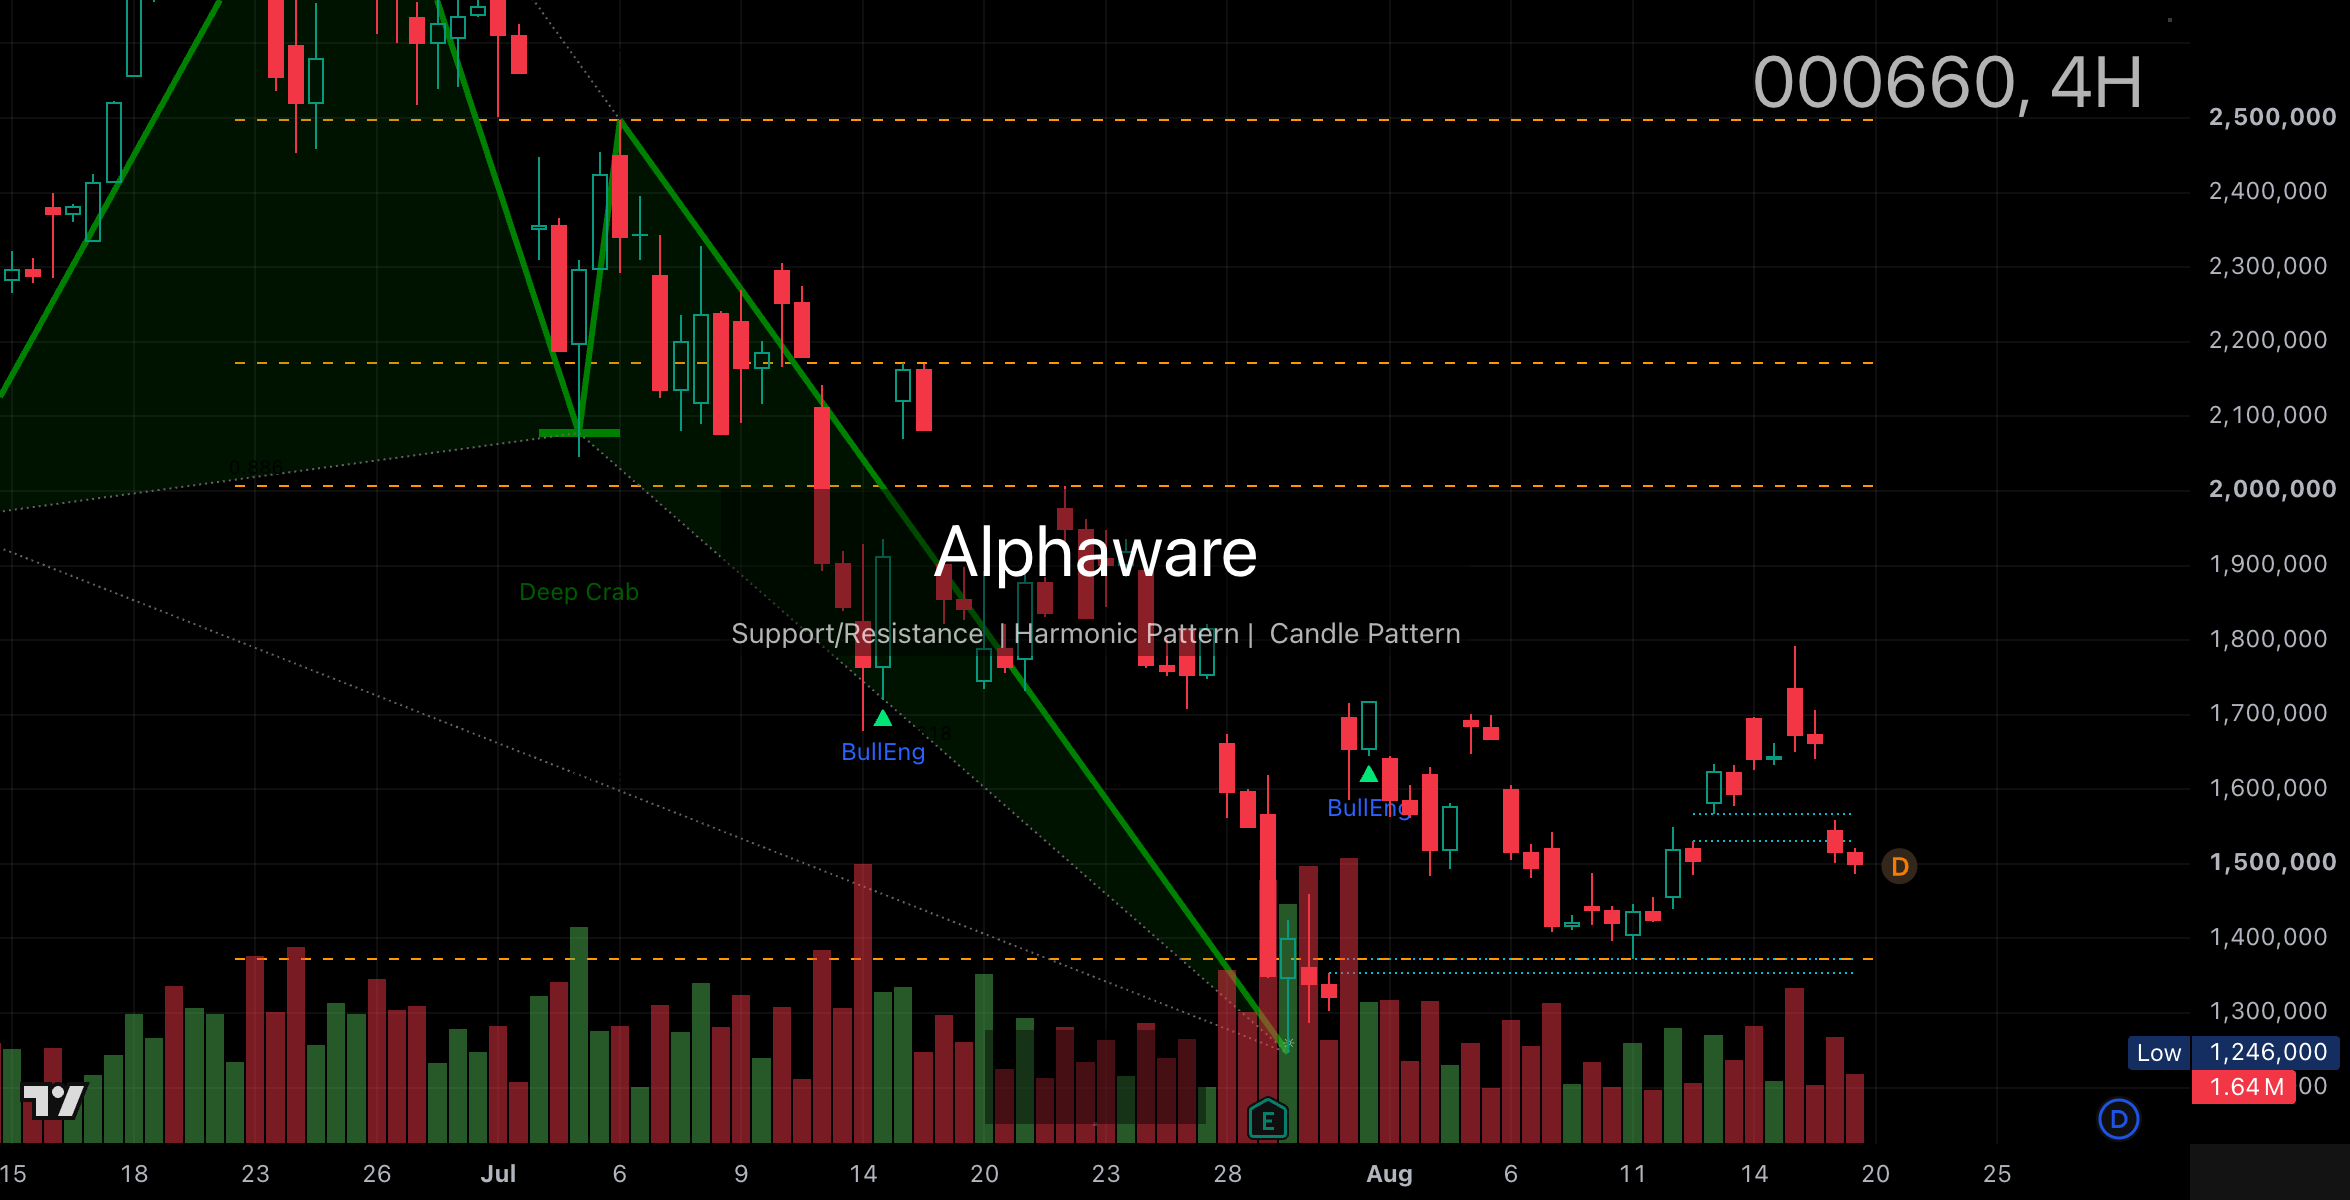
Hynix: gave back the bounce, now 1.50M. 1.35M is the next line.
Dollar, US 10-year, Japan 10-year
Macro does not collapse into the word “tightening.” Yields are retesting highs. The dollar is breaking lower. Those are not the same story.
The US 10-year tagged a 12-hour high at 4.748%, then slipped back toward 4.65%. That is a test of the 4.60%–4.75% box top, not a confirmed break-and-hold.
The Japan 10-year printed 2.952% and sits near 2.90%. The rise since May is intact. Do not read it as a copy of US yields.
DXY lost 99.2 on the 4-hour chart and traded near 98.95. Next line: 98.75. That is why the Korean selloff is a poor fit for a “strong-dollar” one-liner.
| Watch | |
|---|---|
| US10Y | Hold above 4.75% vs break 4.60% |
| JP10Y | Re-break 2.95% vs hold 2.87% |
| DXY | Reclaim 99.2 vs lose 98.75 |
Today’s US session still has the July FOMC minutes. Next week is Jackson Hole (27–29 August). For a week when the yield level matters more than the speech, the live tells are 4.75% and 99.
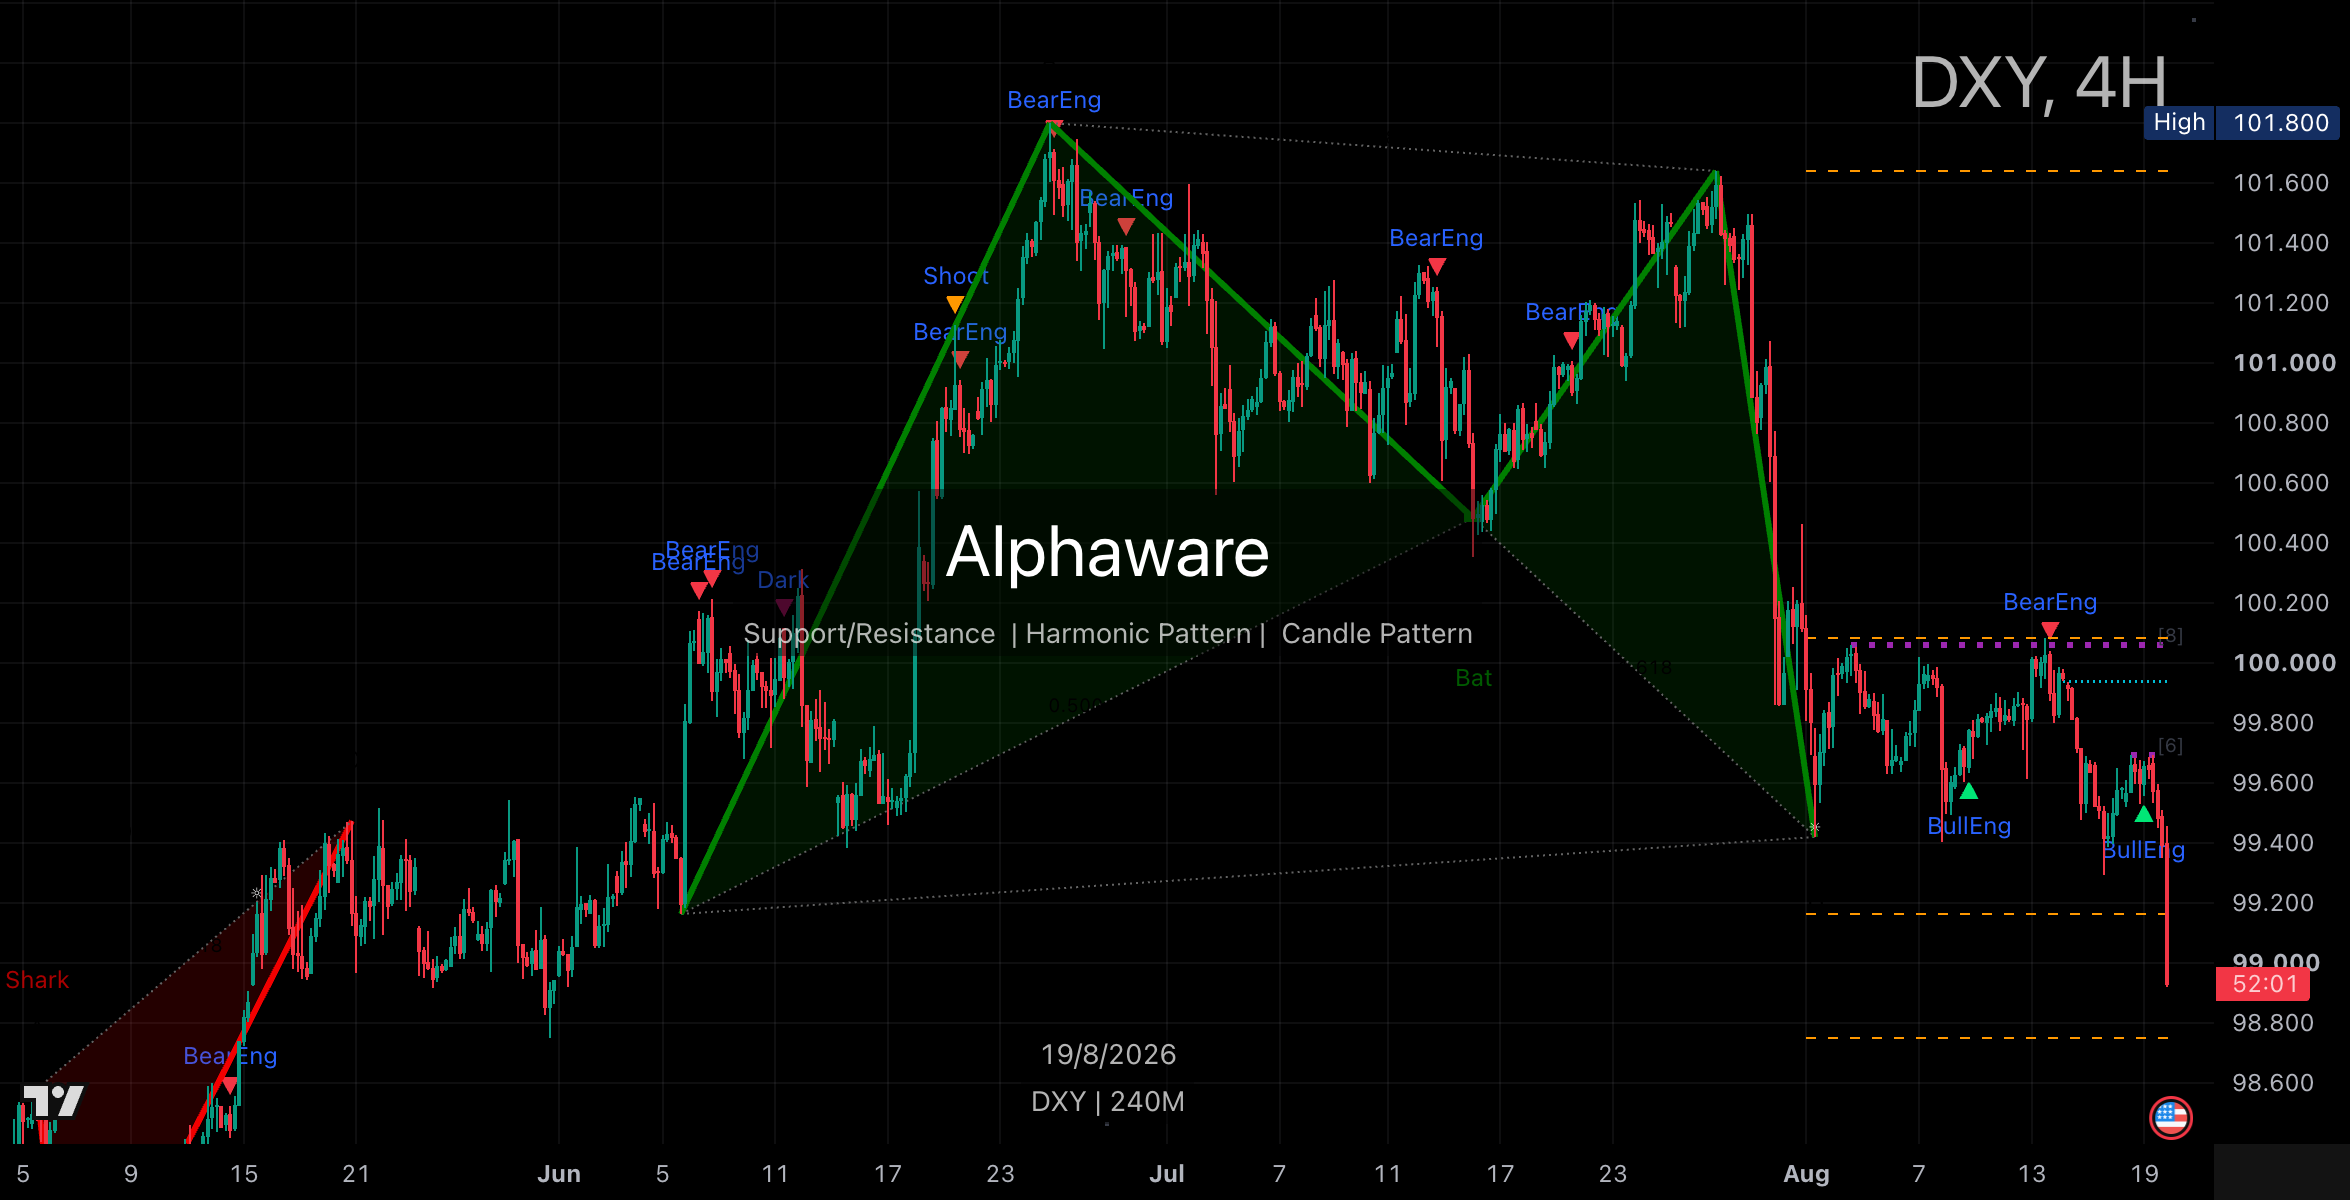
DXY: 99.2 is gone, 98.9 is in play. This is not a dollar-strength tape.
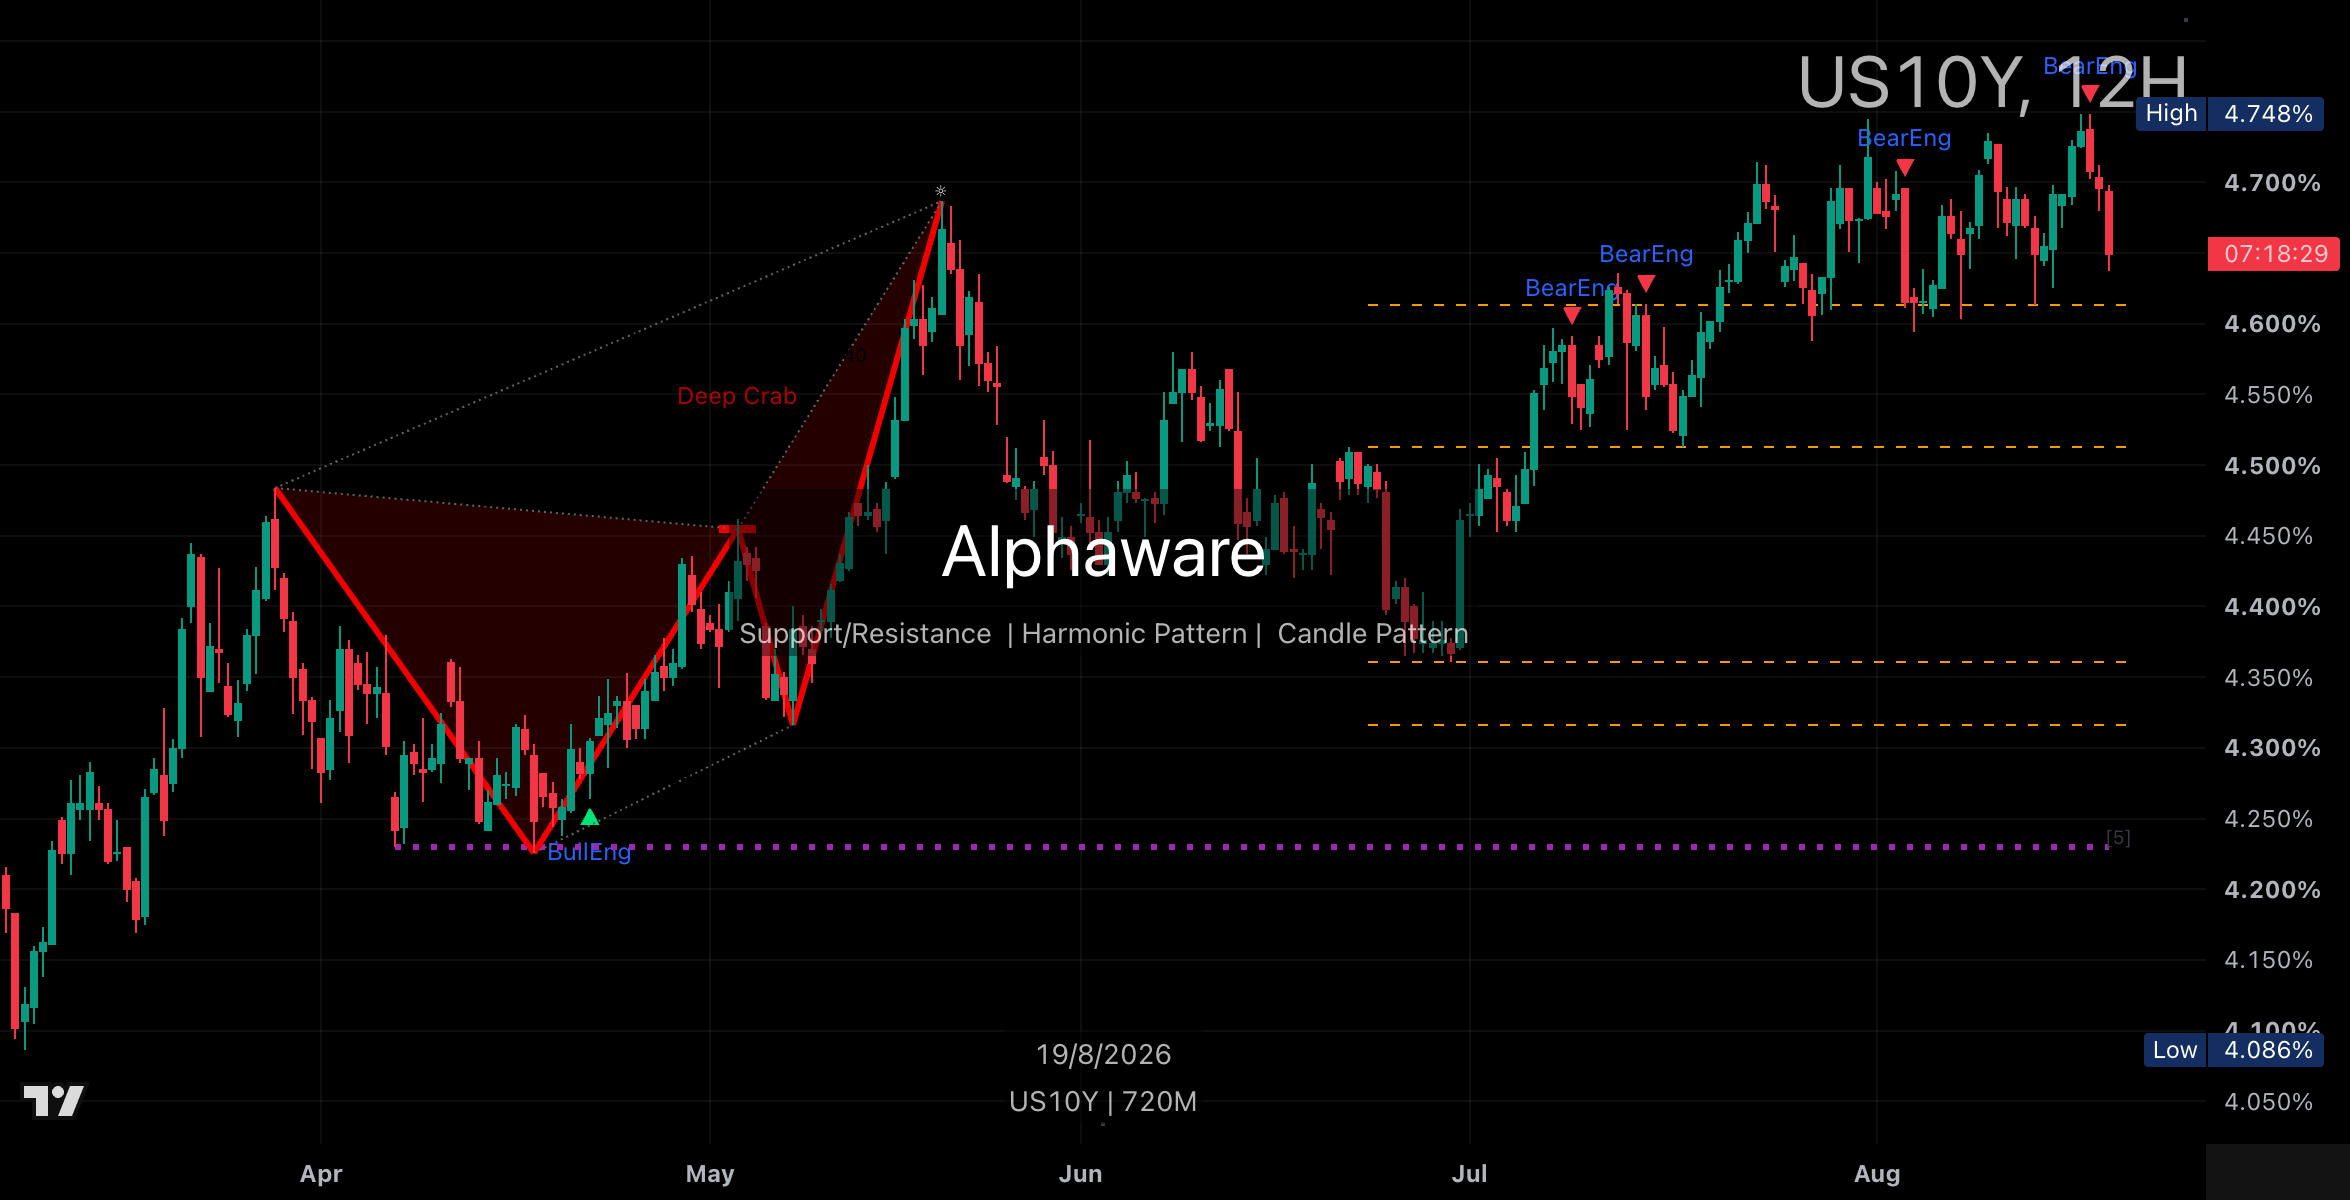
US10Y: a high-side test at 4.75%, then a fade. Not yet a held breakout.
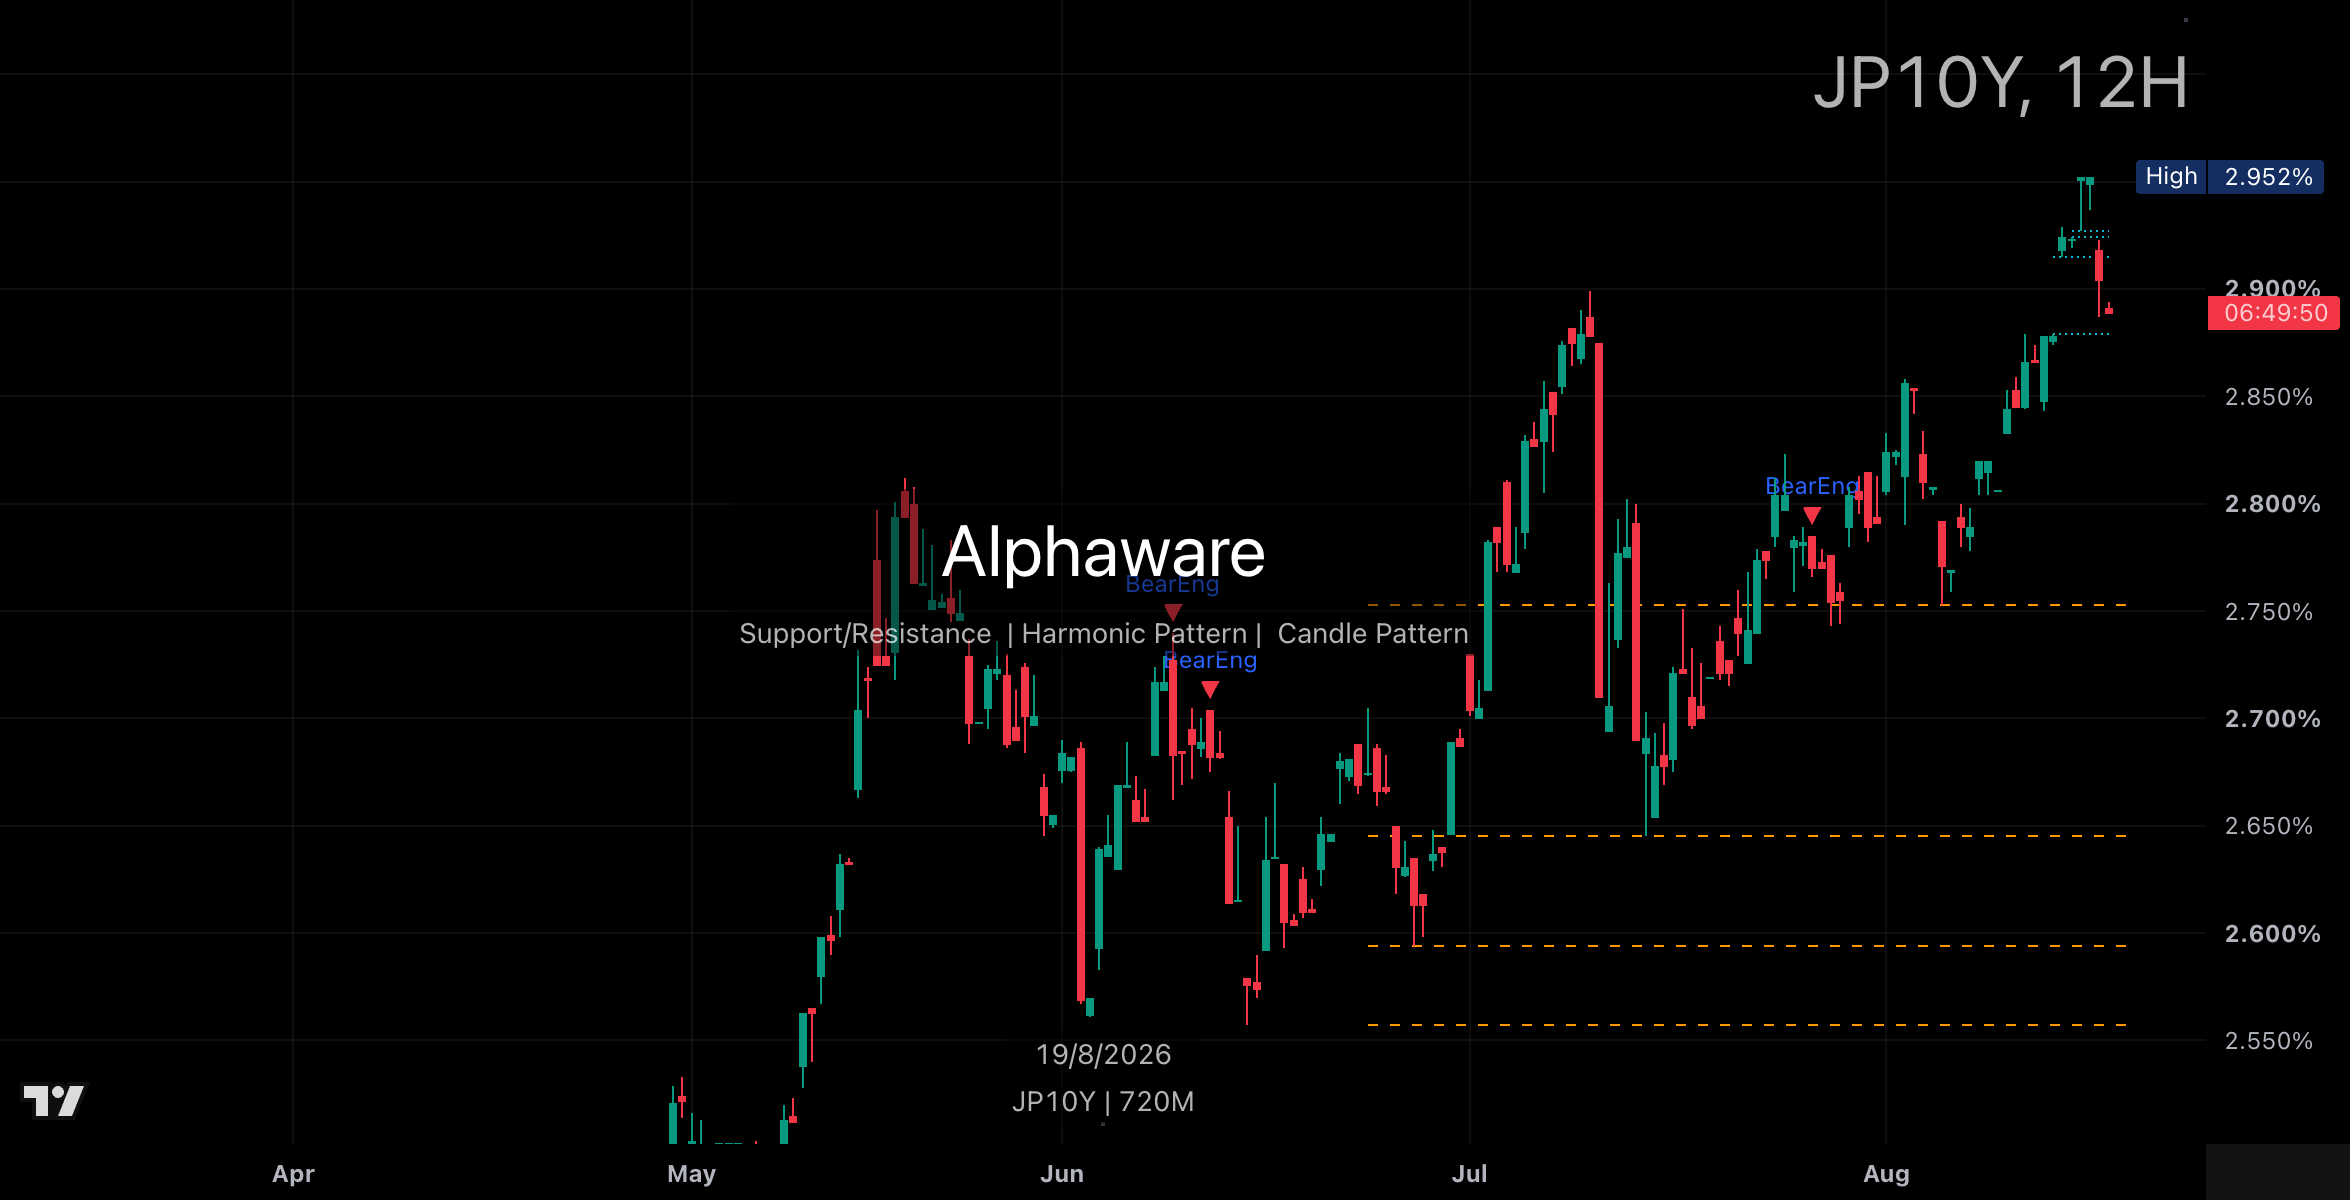
JP10Y: new high, modest pullback. Keep it separate from US yields.
Levels, sentiment, flow
| Item | Snapshot | Watch |
|---|---|---|
| BTC | $65,340 · 24h +1.7% | Hold $65k / reclaim $67k |
| Sentiment | F&G 46 · Fear | Whether price and levels move with the bounce in sentiment |
| ETF 7-day | about +$4.4M (near flat) | 17–18 Aug flipped back to net inflow |
| Funding | +0.0038% | Mildly positive, not crowded |
Fear & Greed has risen from 27–31 a week ago to 46. Extreme fear has eased; greed has not arrived. A two-day ETF bounce does not prove spot demand has turned. Funding near zero is not a squeeze and not a crowded long.
Scenarios — what would change the read
Base
The split tape holds. BTC mid-box, Korean memory digesting a drop, dollar soft, yields near the highs. Wait for a level to break before leaning hard.
For the tape to lean up
- BTC clears and holds ~$67,000
- NVDA keeps $218 and TSM reclaims $435
- The US 10-year drops through 4.60% and Hynix reclaims 1.50M
For the tape to lean down
- BTC loses $65,000 and fails to reclaim $62,500
- Hynix loses KRW 1.35M, TSM loses $405
- The US 10-year holds above 4.75% and risk assets weaken even with a soft dollar
A brief undercut that snaps back is not “it’s over.” It can be one more shake before the range reasserts.
Short FAQ
Is this risk-off?
Mixed. Korean semis look like risk-off. A softer dollar and a BTC test of $65K do not fit that one line.
Does $65,000 mean bitcoin can run?
$65,000 is the mid-line. The box top is $67,000. Until that is held, call it a bounce, not a turn.
Do the chips move as one?
No. Hynix already dropped. NVDA is testing support. TSM is digesting a high and sitting on mid-range support.
Related
Semiconductors Disagree, Bitcoin Stalls at the Box Top
Bitcoin at $65K: Why Four Timeframes Need Separate Reads
Snapshot around 23:00 KST on 19 August 2026. BTC daily, NVDA 1-hour, TSM/Hynix 4-hour, DXY 4-hour, US and Japan 10-year 12-hour, Fear & Greed, 7-day ETF total, funding. Korean index prints are the cash close. Information only — not investment advice.